Debt & Lending Landscape in Colorado
Lending Landscape in Colorado
Coloradans have widely and extensively felt the economic impacts of COVID — including the majority of Coloradans who have some form of debt. This report examines these impacts, diving deep into how Coloradans have undertaken and dealt with household debt in the wake of COVID. Perhaps unsurprisingly, it exposes an ongoing division in community well-being based on wealth, income, and access to meaningful, low-cost credit.
The report first offers a high-level overview of COVID’s impact on Colorado’s economy as well as national debt trends. Next, it examines how Colorado consumers used two specific types of debt — traditional and alternative financial services debt — during the pandemic. The report concludes with efforts Colorado leaders are undertaking, and can grow, to support stronger lending options, particularly for those who use alternative financial service products.
Major Findings
- By and large, debt decreased — for individuals of all incomes — in the first couple years of the COVID pandemic. This was largely due to an influx of federal aid that expanded the social safety net.
- As federal assistance ends, debt has begun to grow again. However, it’s primarily a subset of Coloradans — those who use alternative financial services — who are experiencing challenges paying for this debt. Coloradans with lower incomes and who are from communities of color — groups that suffered the most financial harm during the COVID pandemic — disproportionately use alternative financial service products.
- Even though federal aid is coming to an end, Colorado has state-based mechanisms to better support resident credit and debt needs
Setting the Stage: Economic Conditions in the Midst of COVID
Household debt is linked to surrounding economic forces which directly impact its use. Recognizing this, the following section provides an overview of recent changes stemming from COVID in Colorado’s economy.
COVID-Induced Economic Uncertainty
The COVID pandemic fostered one of the most significant periods of economic uncertainty in recent history. The accompanying downturn left few parts of the economy untouched. This led to an eight percentage point increase in Colorado’s unemployment rate in just three months.
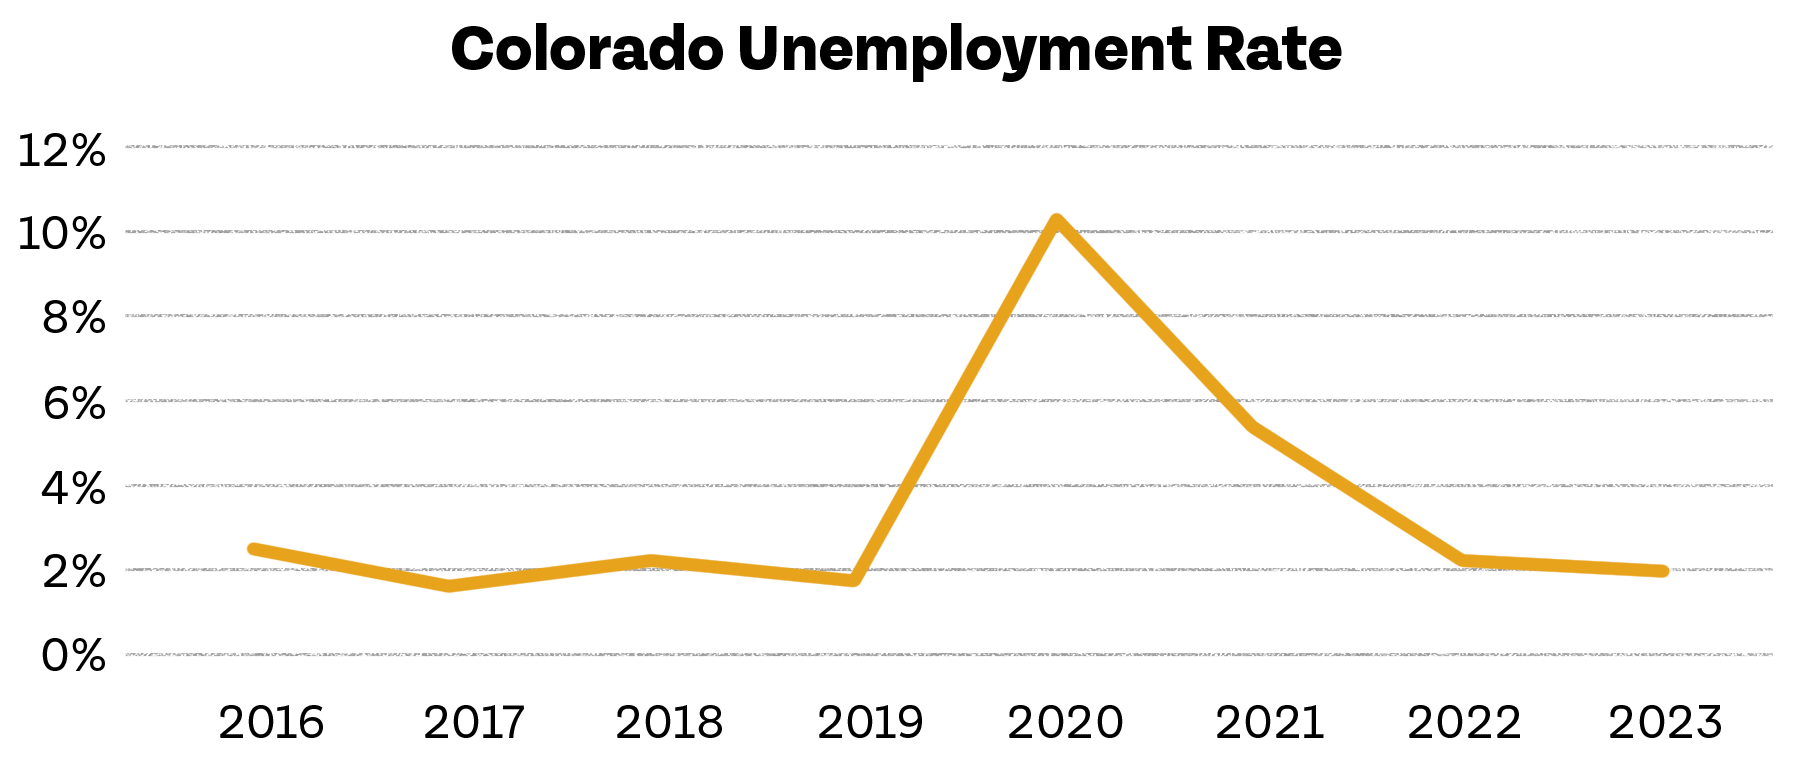
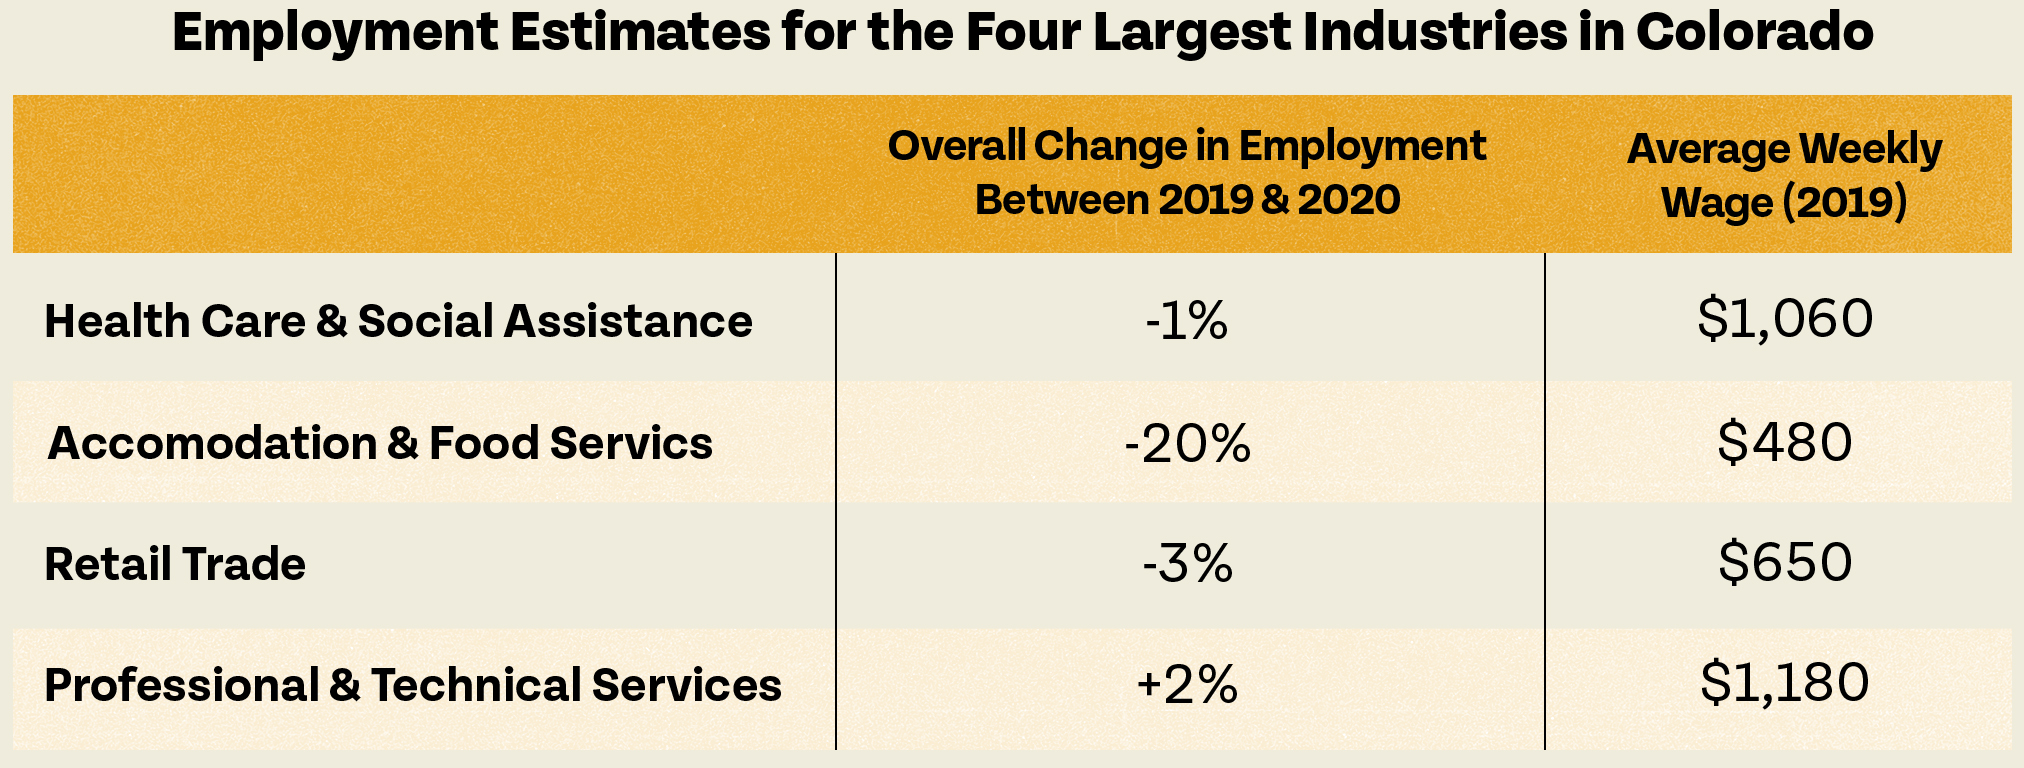
These top-line numbers, however, obscure COVID’s more nuanced economic impacts. Not all Coloradans felt employment changes equally. Instead, those working in the hospitality, retail, and service sectors — positions which pay low wages and are disproportionately staffed by individuals of color — experienced the most acute employment disruptions, as evidenced below.
A Massive Influx of Federal Aid Keeps Families Afloat
Despite the job losses we describe above, poverty rates dropped during COVID. This was largely due to an expanded social safety net which involved:
- Expanding the child tax credit
- Increasing SNAP benefits for eligible beneficiaries
- Deferring payments on federal student loan debt
- Increasing unemployment insurance benefits
In addition to keeping millions of individuals across the country out of poverty, this additional support led to a nationwide increase in individual savings — including for those with the lowest incomes.
An End to Federal Assistance
Despite their success, many of the programs that buoyed economic well being over the past three years have already, or are scheduled to end soon. In addition, there has been a corresponding rise in economic stress. The 2022 Colorado Pulse Survey saw a 13 percent increase in the number of individuals who cite cost of living as the most important challenge facing the state.

While all Coloradans share these sentiments, those with lower incomes felt the challenges are most acutely. High inflation and slower wage growth hit this segment of Coloradans the hardest.
Takeaways from an Evolving Economy
Collectively, the above data points illustrate COVID’s differential impact on Coloradans. The pandemic most affected those with the lowest incomes. An expanded social safety net supported these families initially, and it blunted the worst of the impacts. Now that this safety net is receding, there are signs of growing economic insecurity for these Coloradans.
Conversely, the pandemic had a more limited impact on those in higher wage positions. In addition to experiencing less job loss, these Coloradans were more likely to benefit from increased home values and growth in the stock market.
As will be seen below, these diverse COVID impacts based upon wealth mirrors Coloradans’ differential experiences with debt over the past few years.
High-Level National Debt Trends
Largely thanks to the above-mentioned safety net expansions, most debt fell during the initial months of the COVID pandemic. After increasing every year since 2013, total credit card debt dropped by 13 percent during the third quarter of 2020.
In addition to the overall amount of debt, debt service ratios also decreased. Debt service ratios are the percentage of household income needed to cover debt service payments. As seen in the chart below, these reductions occurred for both overall consumer and mortgage debt.
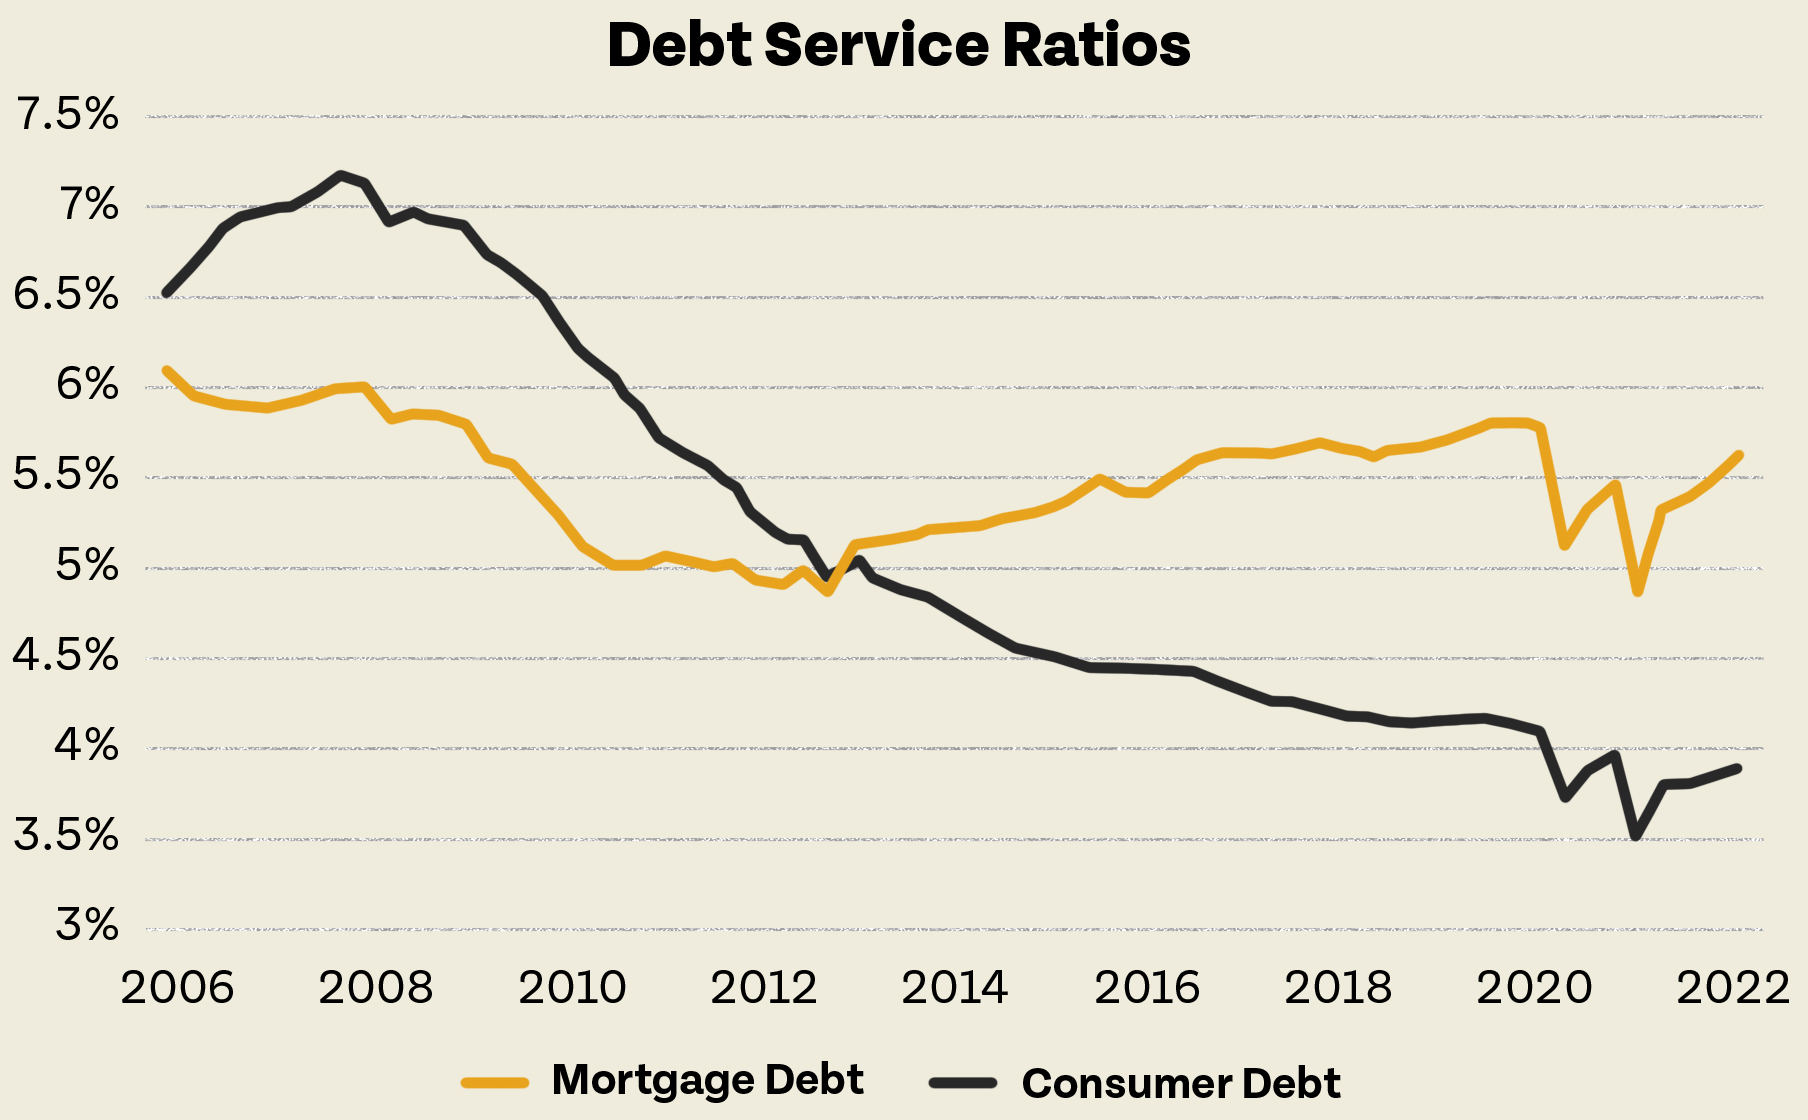
Researchers attribute the above-referenced reductions to increased federal support. As noted by the Federal Reserve Bank of Dallas, “the prevalence of various assistance programs helped boost savings and broadly reduce debt.” The National Bureau of Economic Research found that almost a third of households used stimulus payments from the Coronavirus Aid, Relief, and Economic Security (CARES) Act, which provided every family at least $1,200 dollars, to repay debt.
Notably, however, downward debt trends are beginning to reverse themselves. For example, the New York Federal Reserve recently reported growth in both total and delinquent debt.
A Deeper Dive into Colorado Debt
While limited in many respects, some data illuminates Coloradans’ evolving relationship with debt. Before exploring this relationship, however, it’s important to first recognize how debt varies and the resulting implications.
Traditional Debt
As defined in this report, traditional debt includes mortgage, student loan, credit card, and auto loan debt. In contrast to alternative options, traditional debt is:
- Offered through traditional lending institutions, like banks
- Reported to major credit agencies, resulting in relatively consistent public data
Though not true for all forms of traditional debt, these obligations are often viewed as long-term investments. For example, home ownership — despite accompanying mortgage debt — is often a prudent investment that grows personal and intergenerational wealth.
Alternative Financial Services (AFS) Debt
The Federal Deposit Insurance Corporation (FDIC) defines alternative financial services (AFS) as those offered “outside of federally insured banks and thrifts.” AFS products include payday and alternative charge, rent-to-own, installment (which comprises the largest portion of AFS loans), and buy-here-pay-here auto loans.
In contrast to traditional products, AFS loans are:
- Provided by non-traditional lending institutions
- Often not reported to major credit institutions, resulting in relatively minimal public data
While not true for all AFS loans, these products are often used to bridge periods of economic stress.
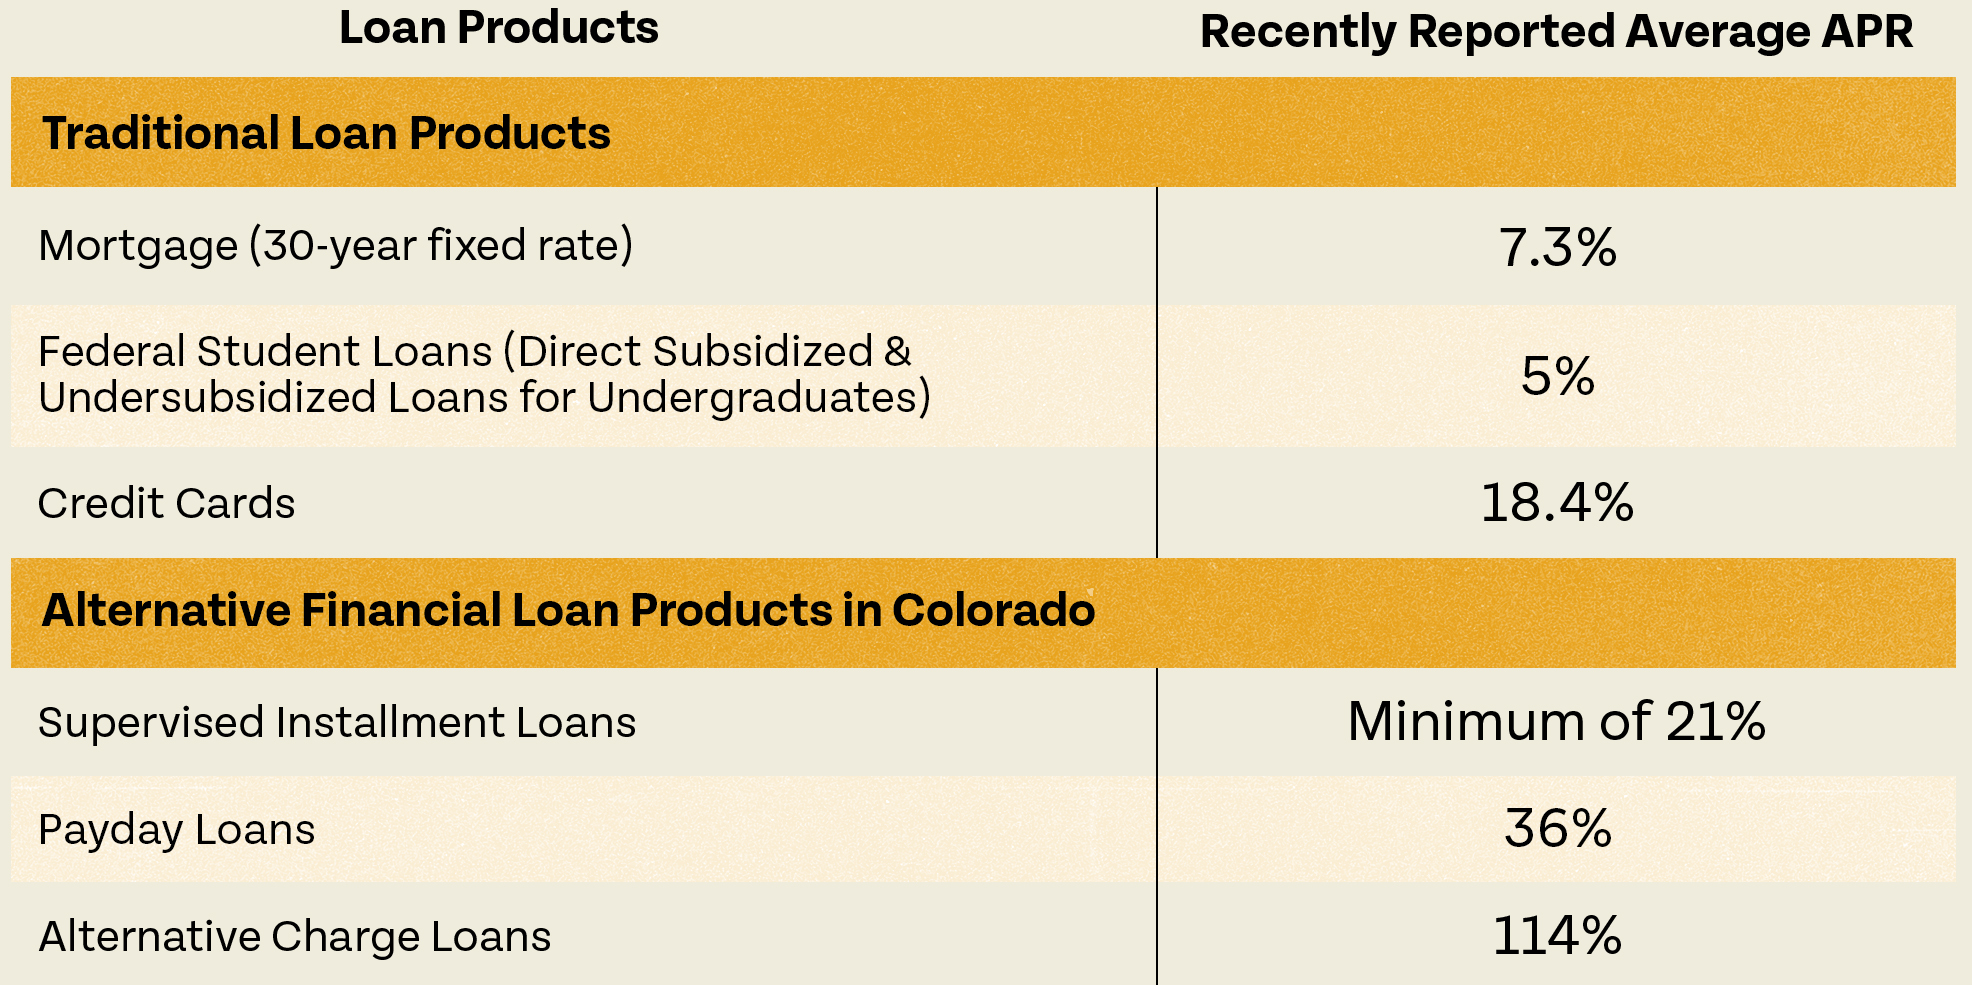
Differences between AFS and traditional debt have important implications. This is particularly true as it relates to credit access and cost. Those who take on traditional debt must often have a bank account and a relatively healthy lending history. Ostensibly because these factors indicate some financial stability, traditional loans often have relatively low interest rates.
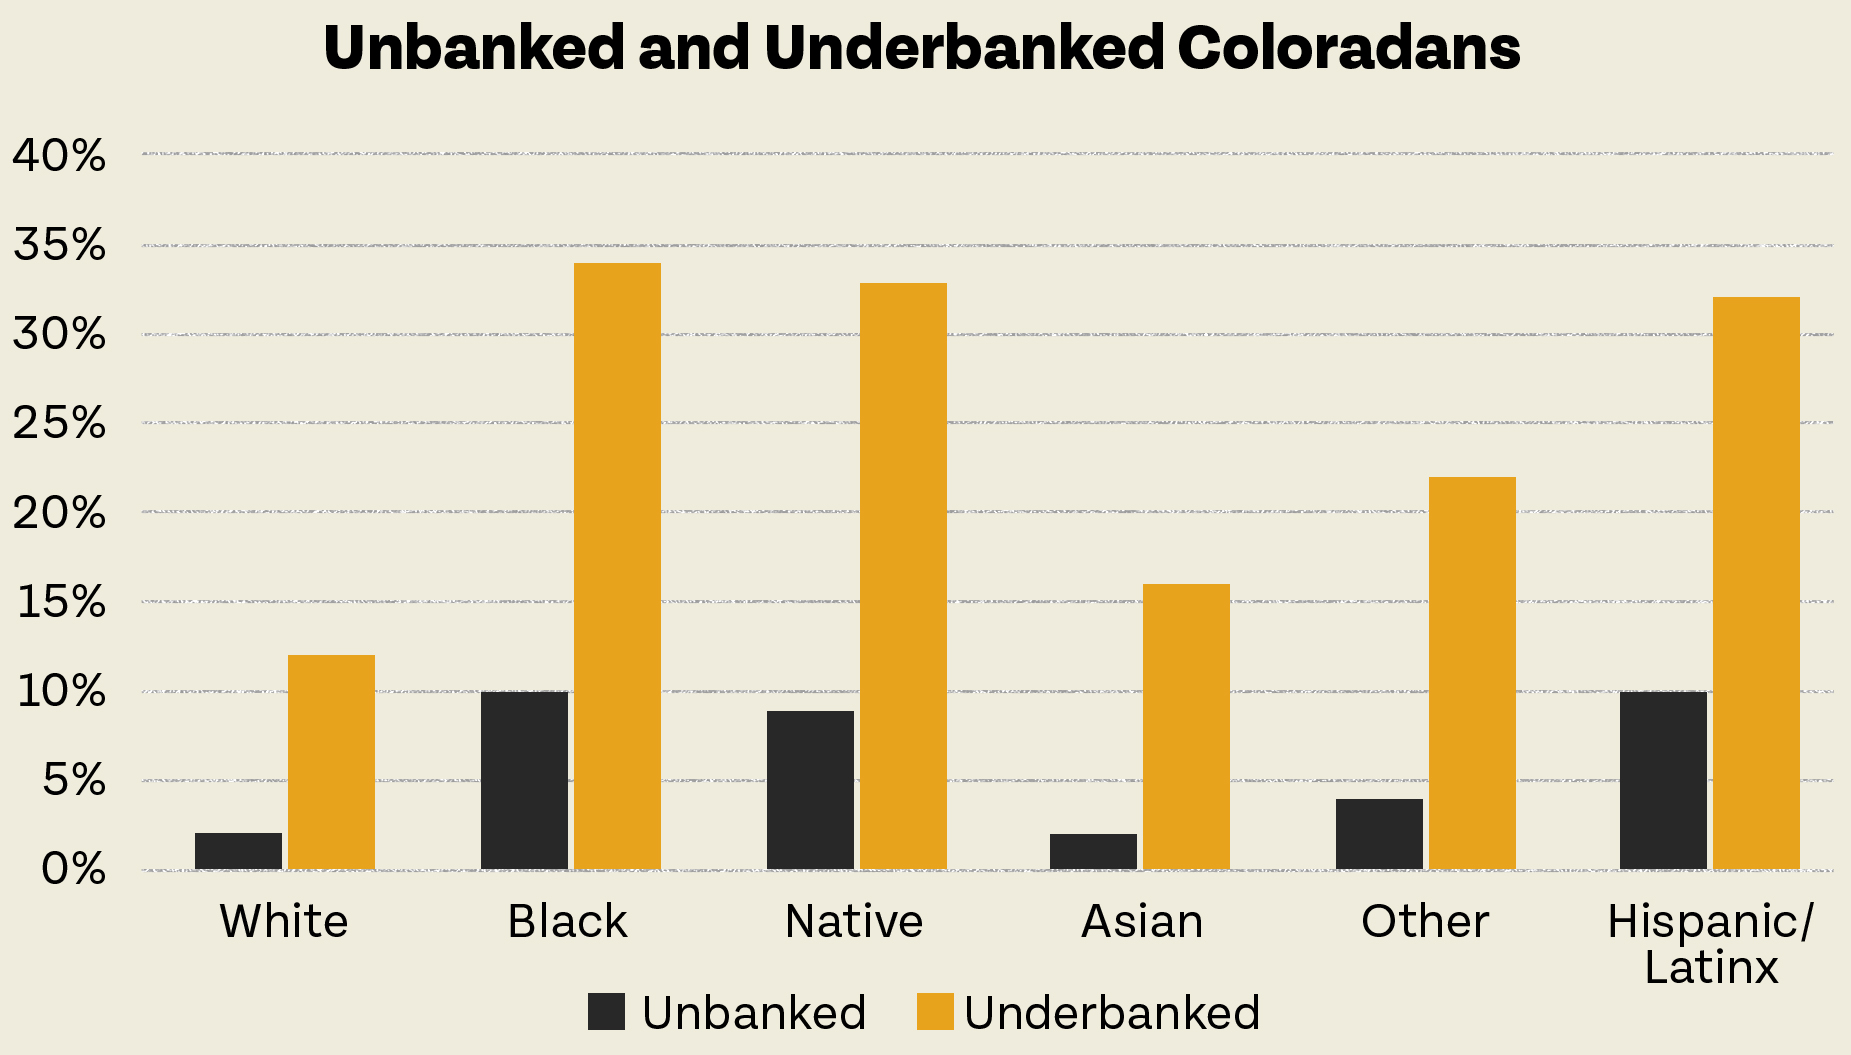
In contrast, lenders offering AFS products do so outside of traditional lending institutions. Unbanked or underbanked people take out many of these loans. “Unbanked” or “underbanked” means the individuals do not have a bank account, or do, but still use non-traditional financial services. As a result, they have limited access to traditional forms of credit. According to the FDIC, those who have lower incomes, less formal education, and/or are Black, Hispanic, and are single mothers are most likely to be underbanked.
Regulators allow AFS lenders to charge higher rates and fees for their products, as seen below, because lendees often have either poor or no credit. Lenders say this raises repayment concerns and necessitates a higher interest rate to recoup costs.
However, these higher interest rates and fees on AFS products can significantly raise lending costs. Higher interest rates also are connected to cycles of debt and poverty.
Taken together, these conditions reflect another point of economic division. Those who are white and wealthier have higher access to the traditional, lower-cost loans associated with wealth building. Those who rely on higher cost AFS products are more likely to have lower incomes and be from communities of color.
Finally, it is worth highlighting the economic trajectory each group of lendees had during COVID. These factors are important when considering respective debt trends. Generally, those who use traditional forms of debt were more likely to experience relatively minimal economic disruptions during COVID. These Coloradans were more likely to maintain stable employment and even report an increase in financial security. Those from lower-income communities, who tend to rely on AFS products, suffered greater job loss and increasingly are facing more acute economic pressures.
Recent Colorado Trends in Traditional Debt
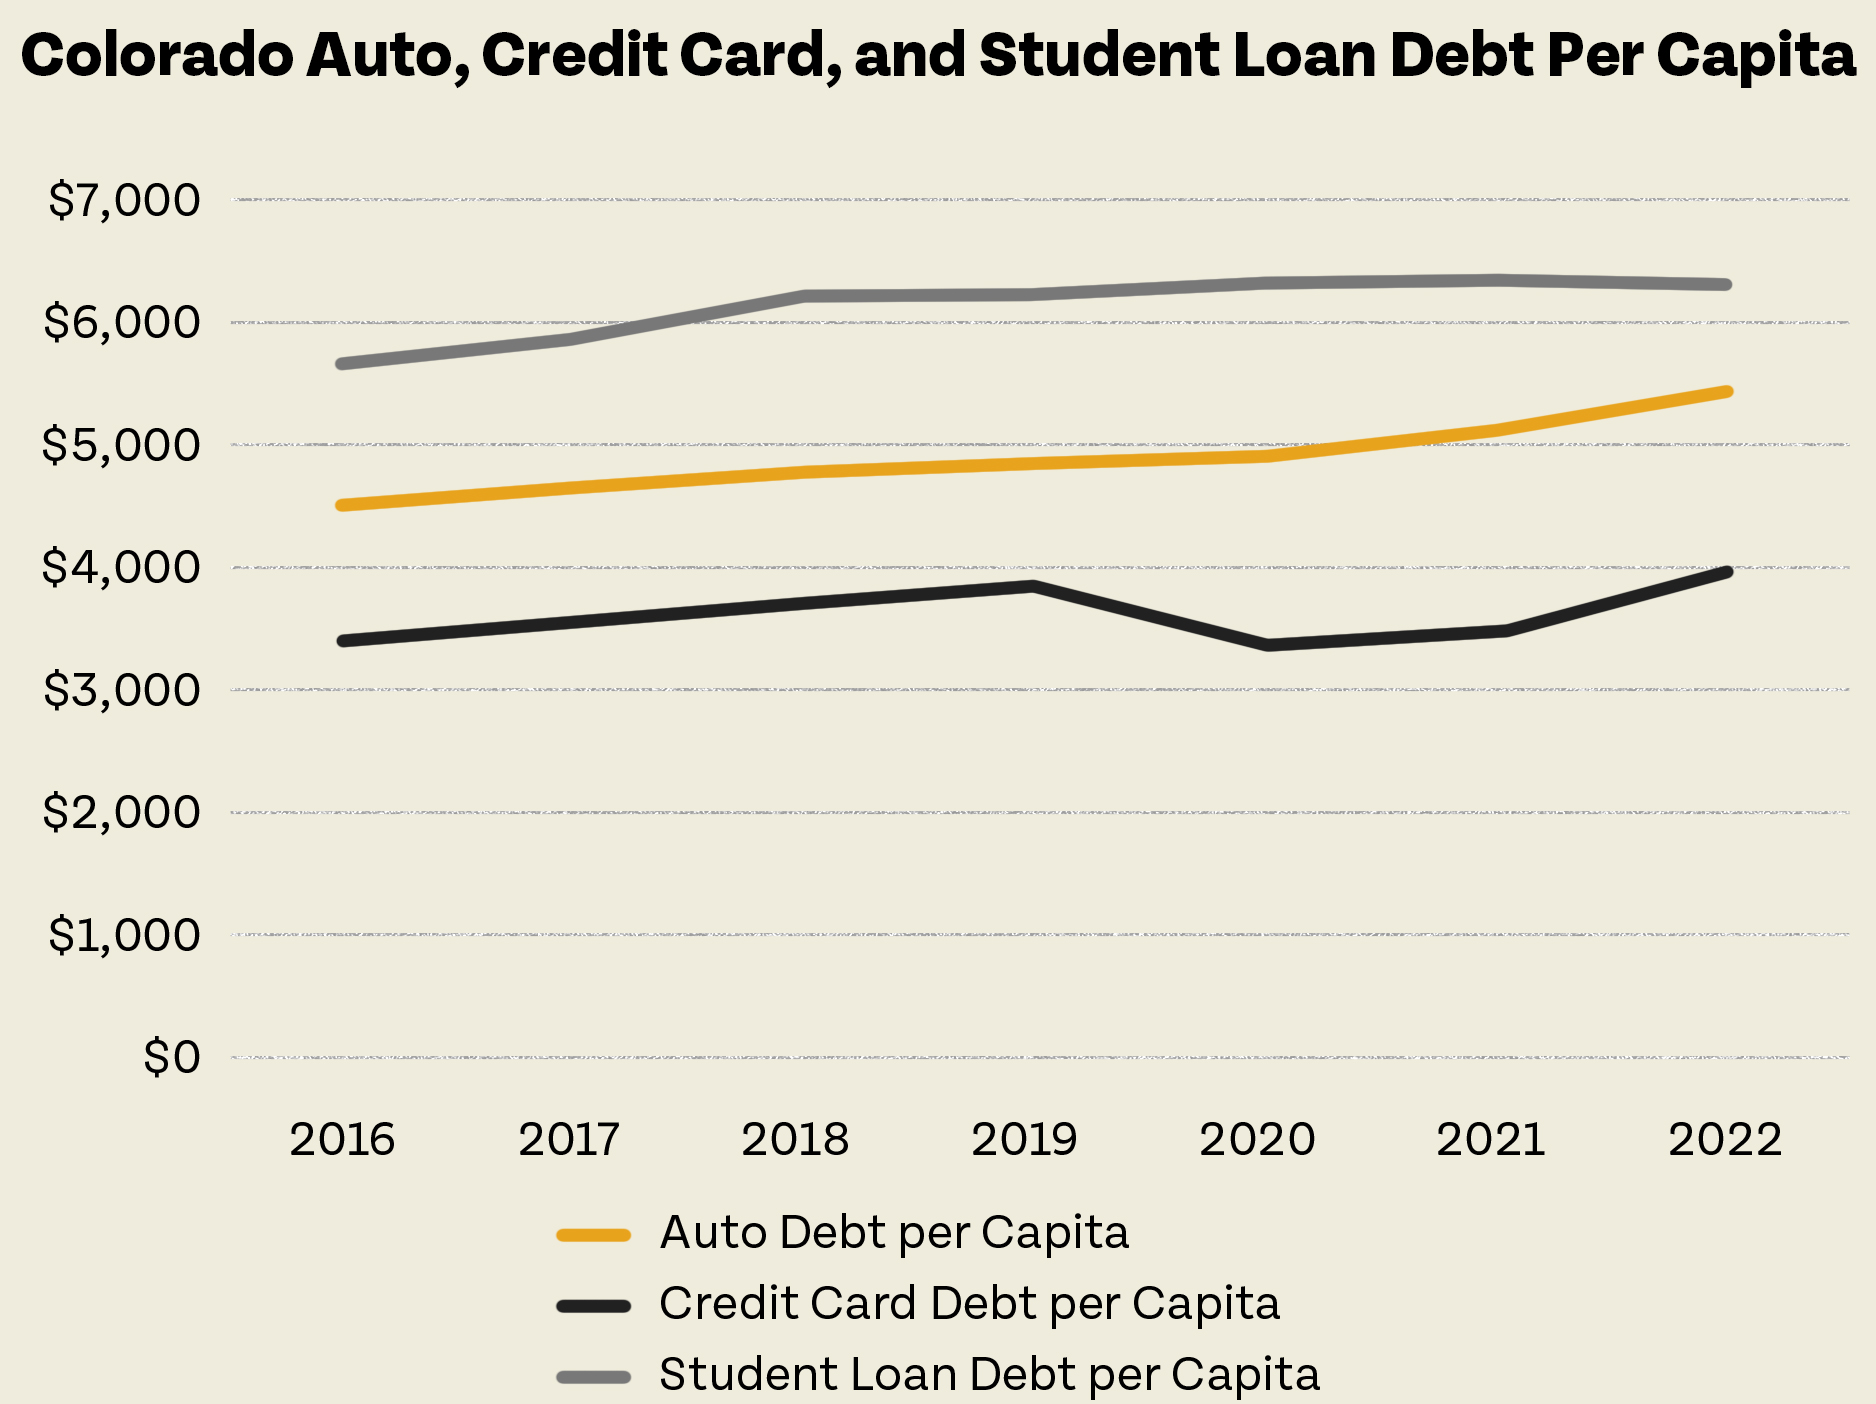
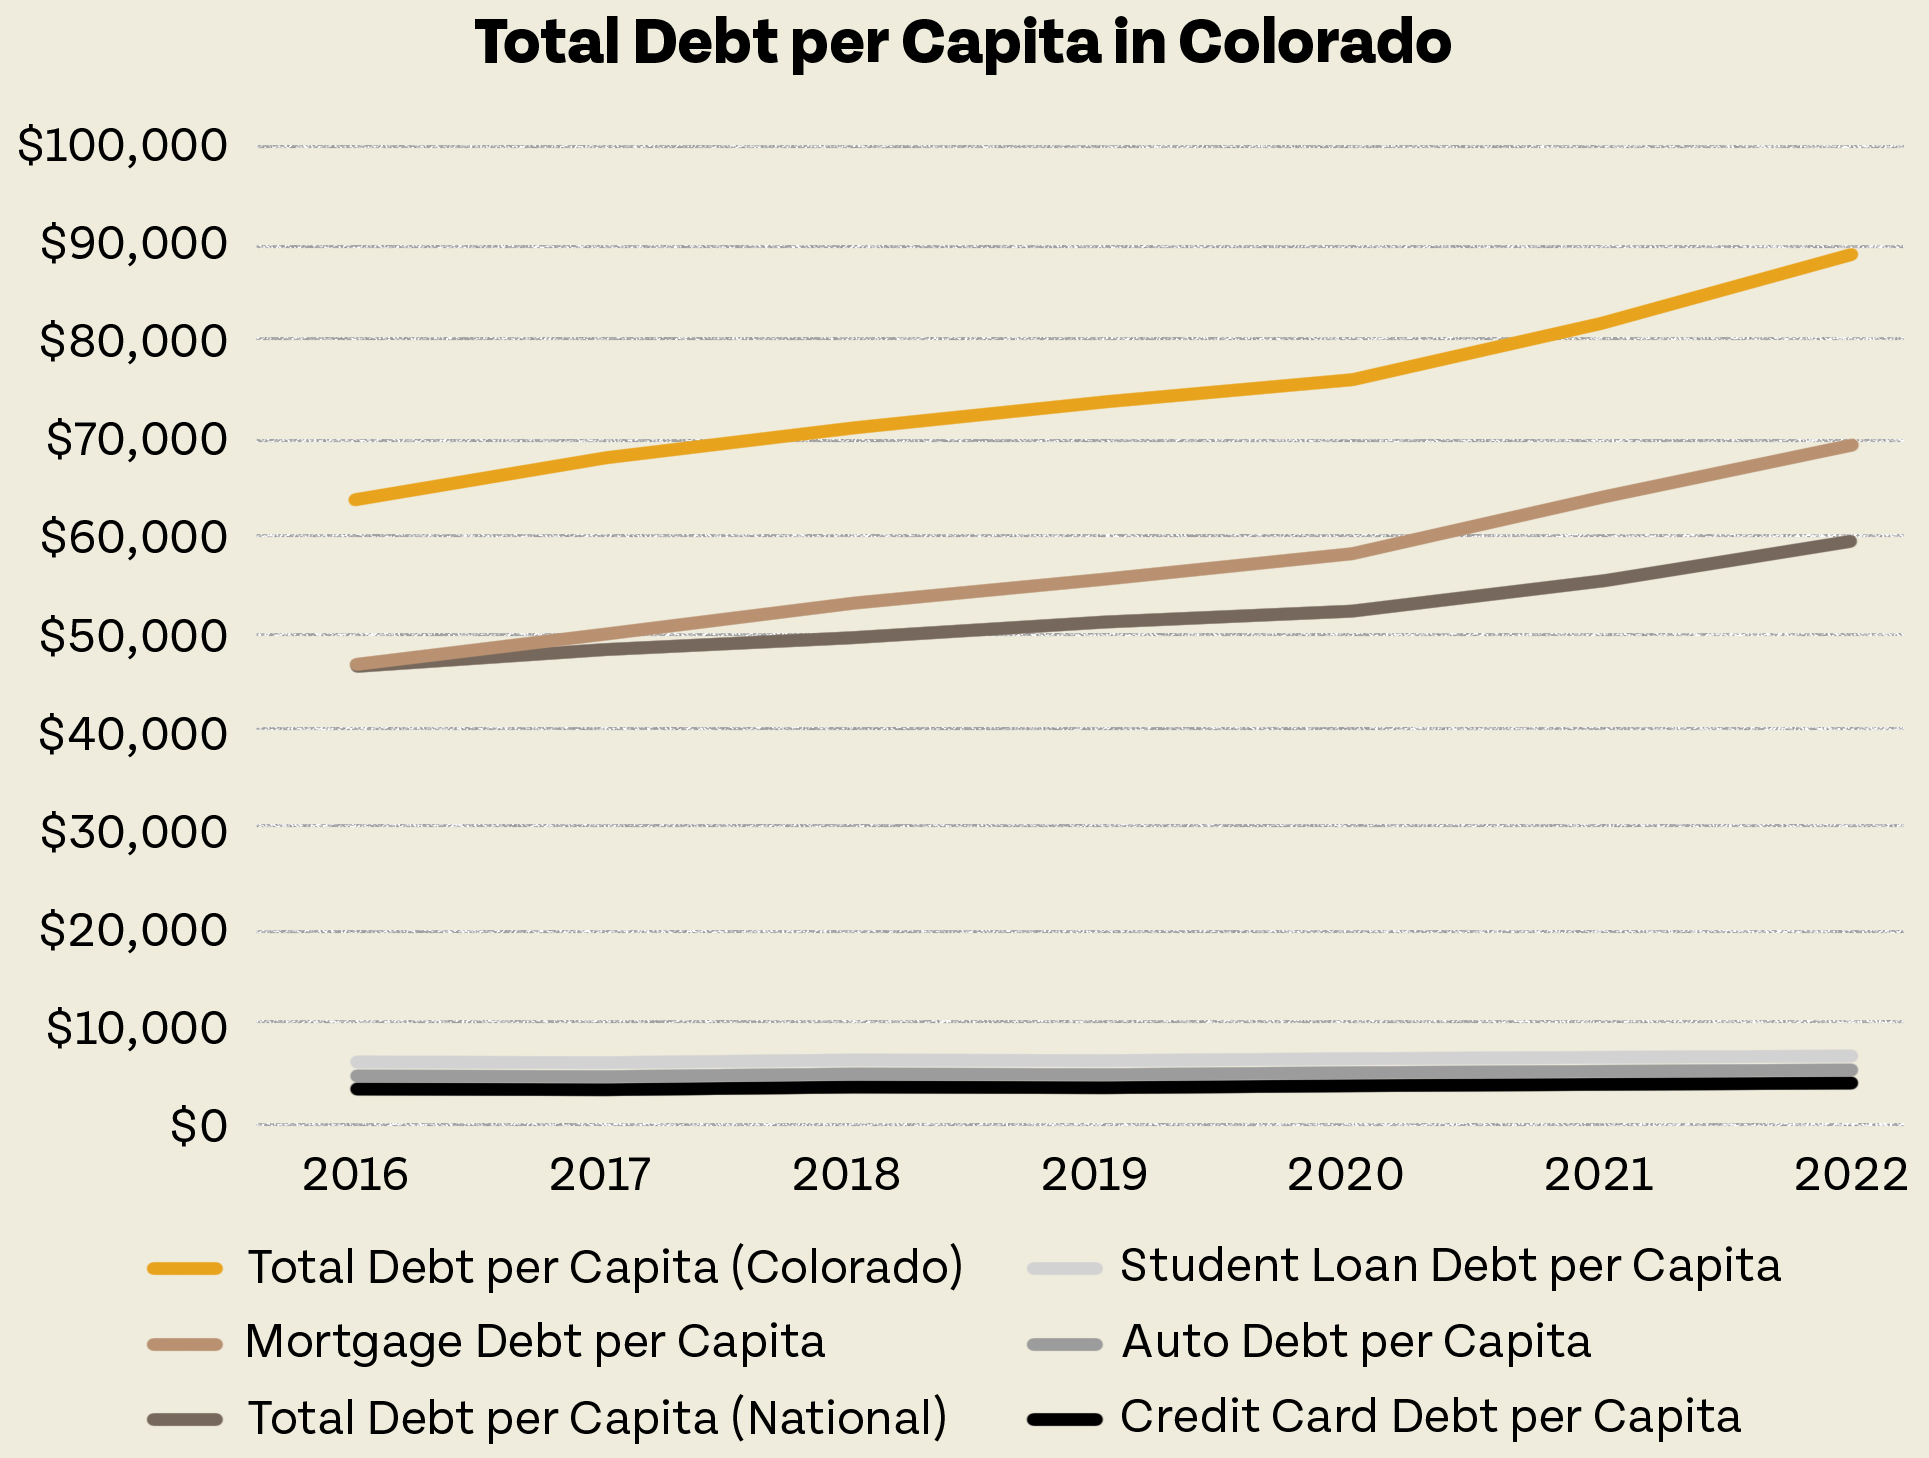
Over the past several years, most forms of traditional debt in Colorado have remained relatively flat. Mortgage debt, however, is the notable exception. As shown below, it has grown significantly since 2020 and is driving Colorado’s overall growth in total per capita debt. Brookings notes that much of the mortgage debt increase is attributable to the purchase of more expensive homes. This is particularly true among those with higher incomes and credit scores.
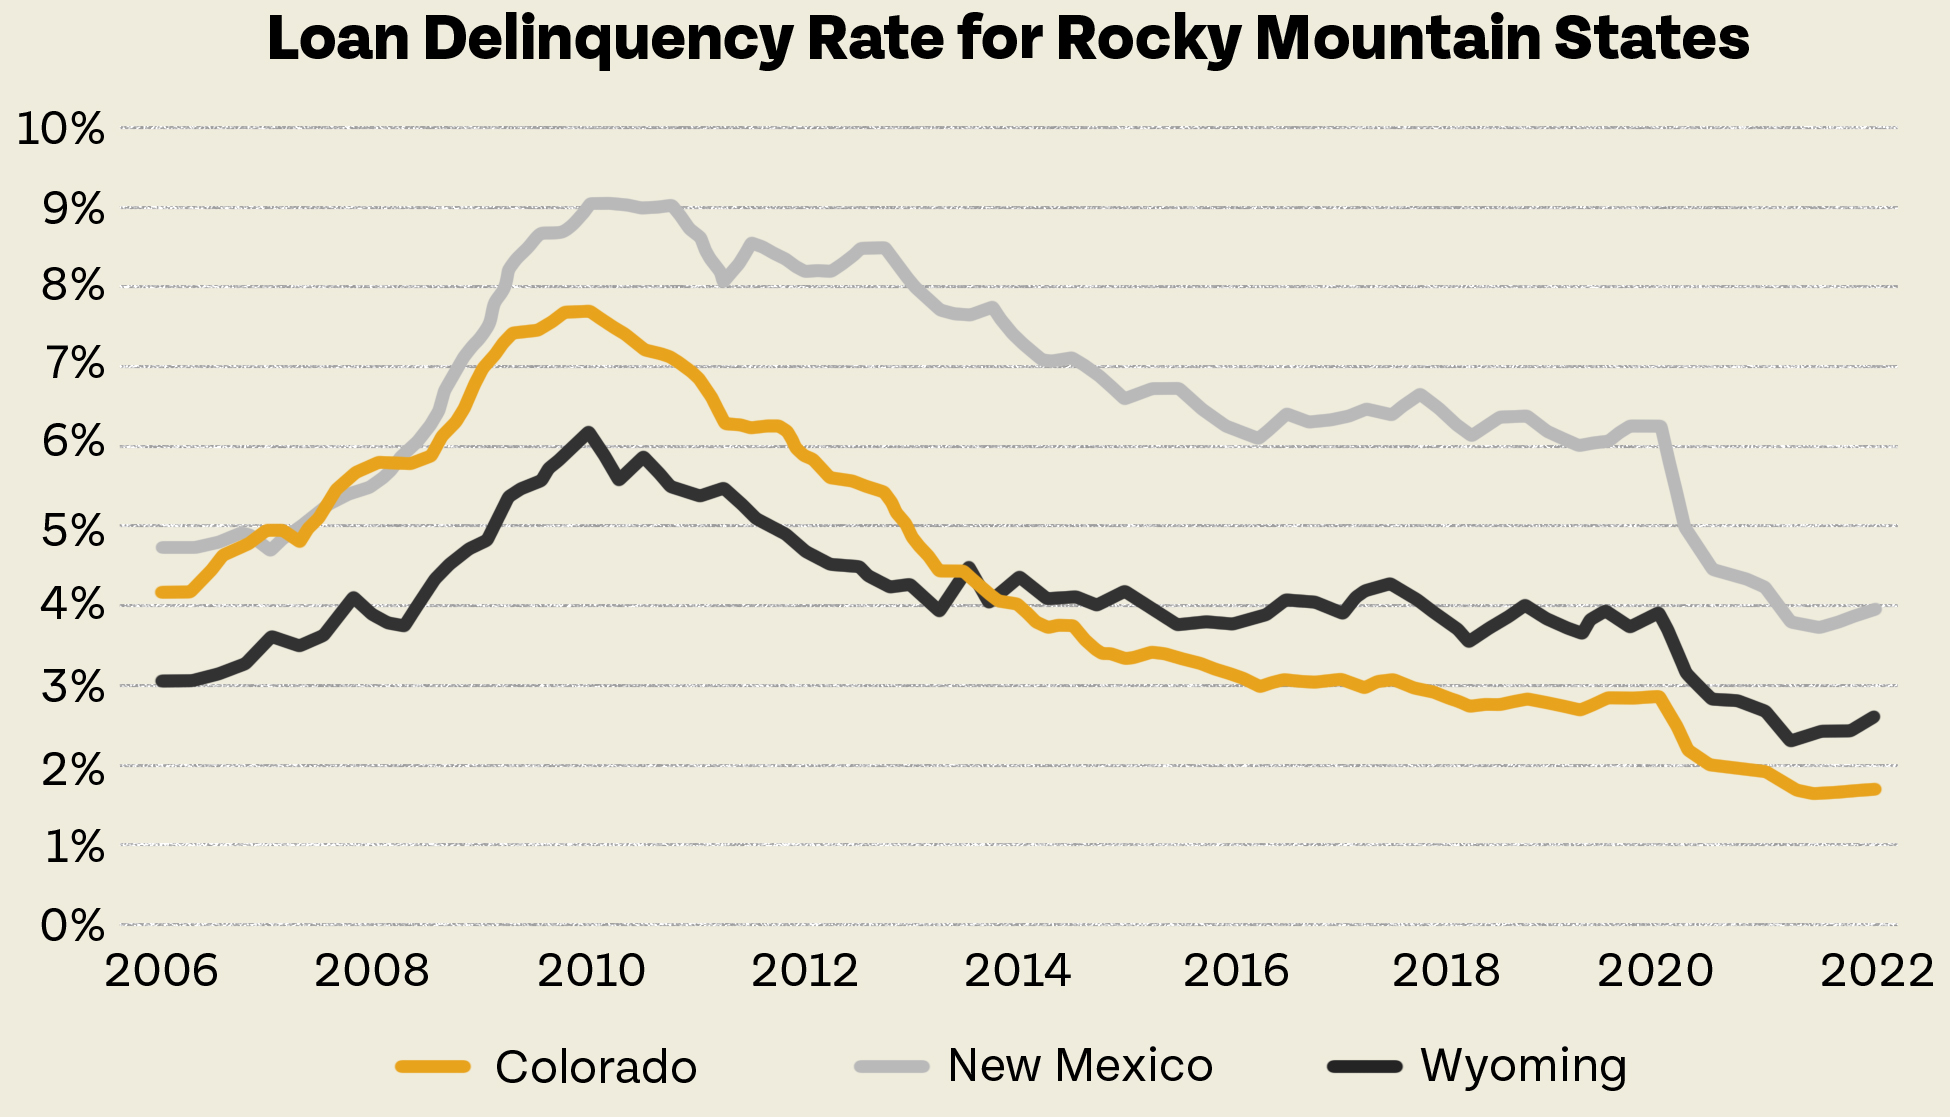
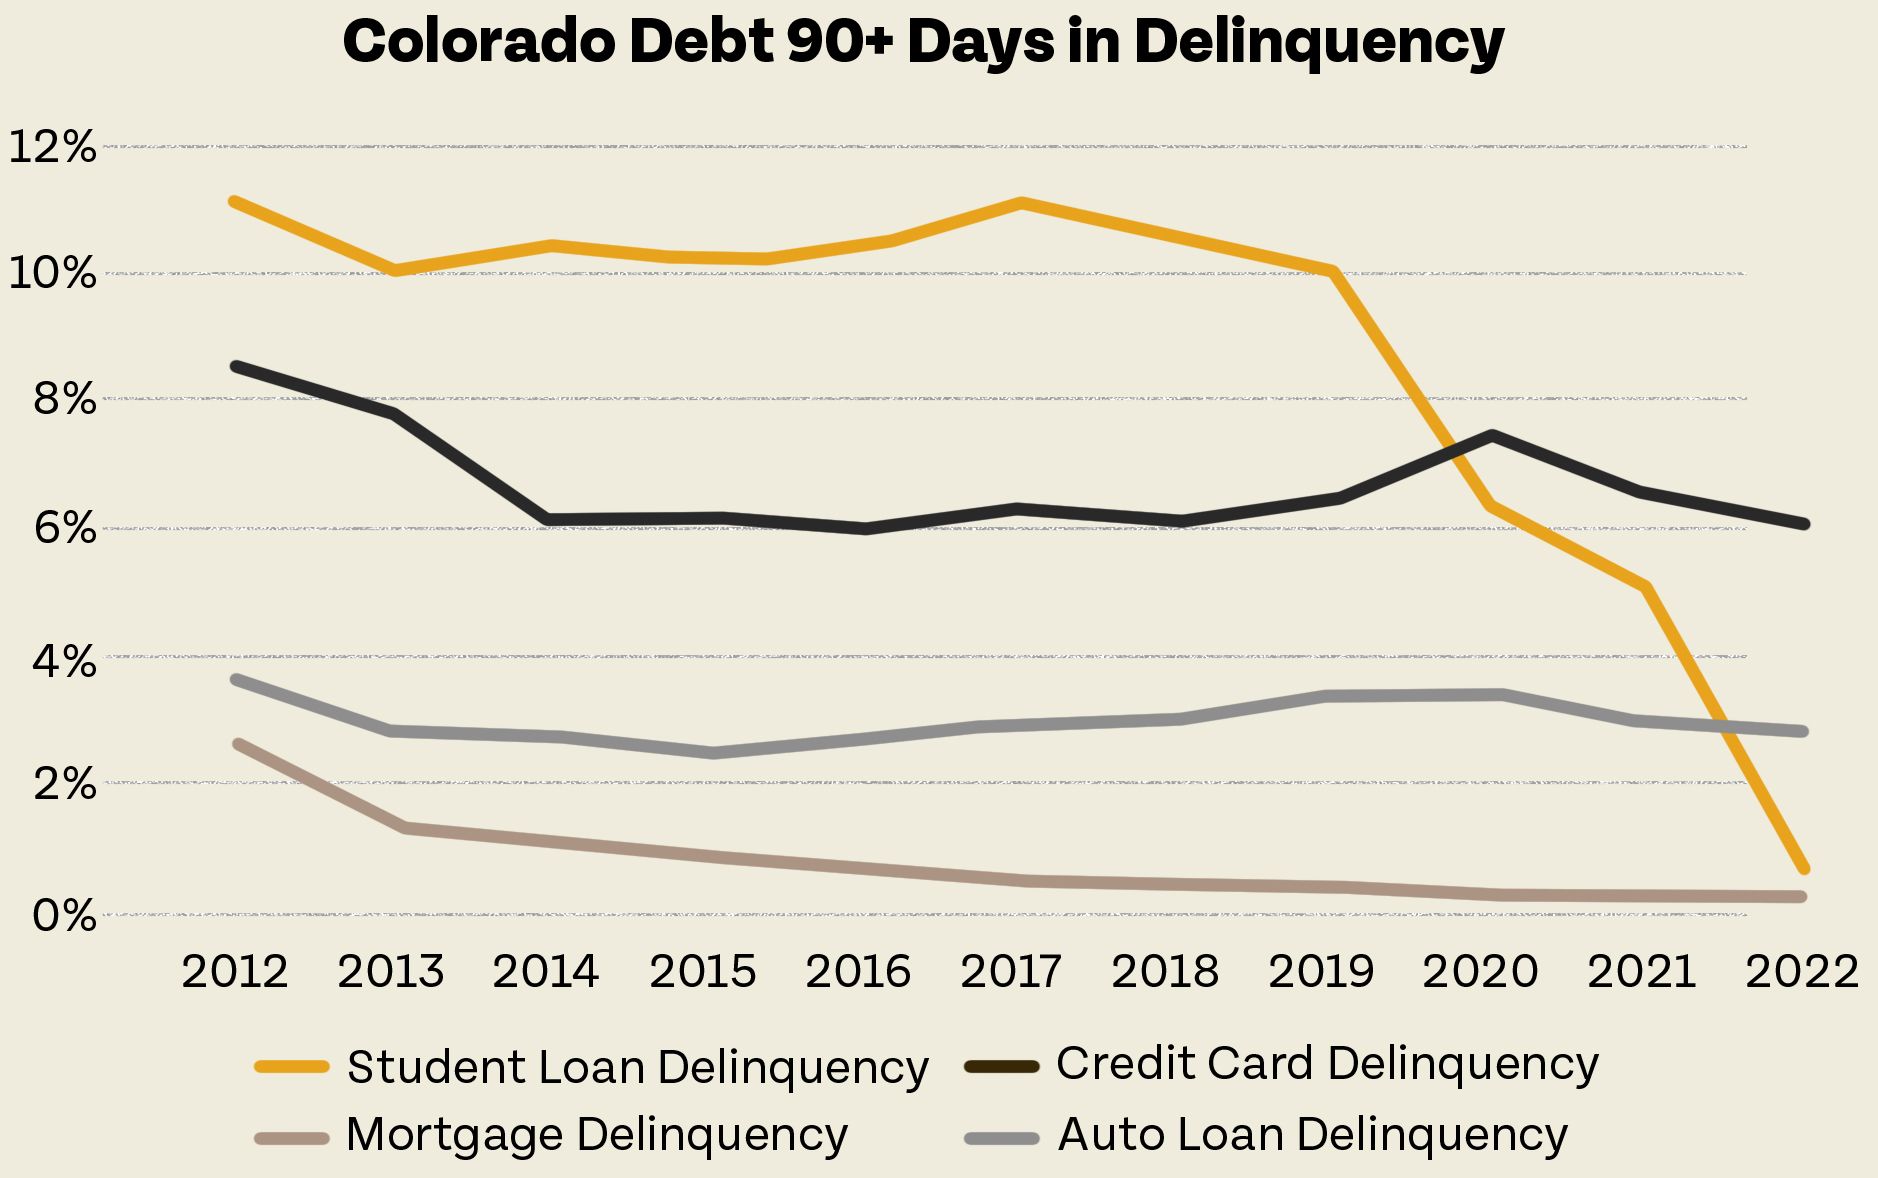
In addition to prevalence, it’s also important to examine whether Coloradans are able to manage and repay their debt. As expected, given the above-mentioned financial assistance and relative well-being of those who use traditional products, overall delinquency rates for traditional loans dropped in 2020 and have remained low.
When further disaggregated by debt type, it becomes clear that while delinquency rates fell for all traditional loans, we see the steepest reductions for student loans. Thanks in large part to federal action, student loan delinquency in Colorado dropped from 10 percent to less than 1 percent.
Differences Across Demographics
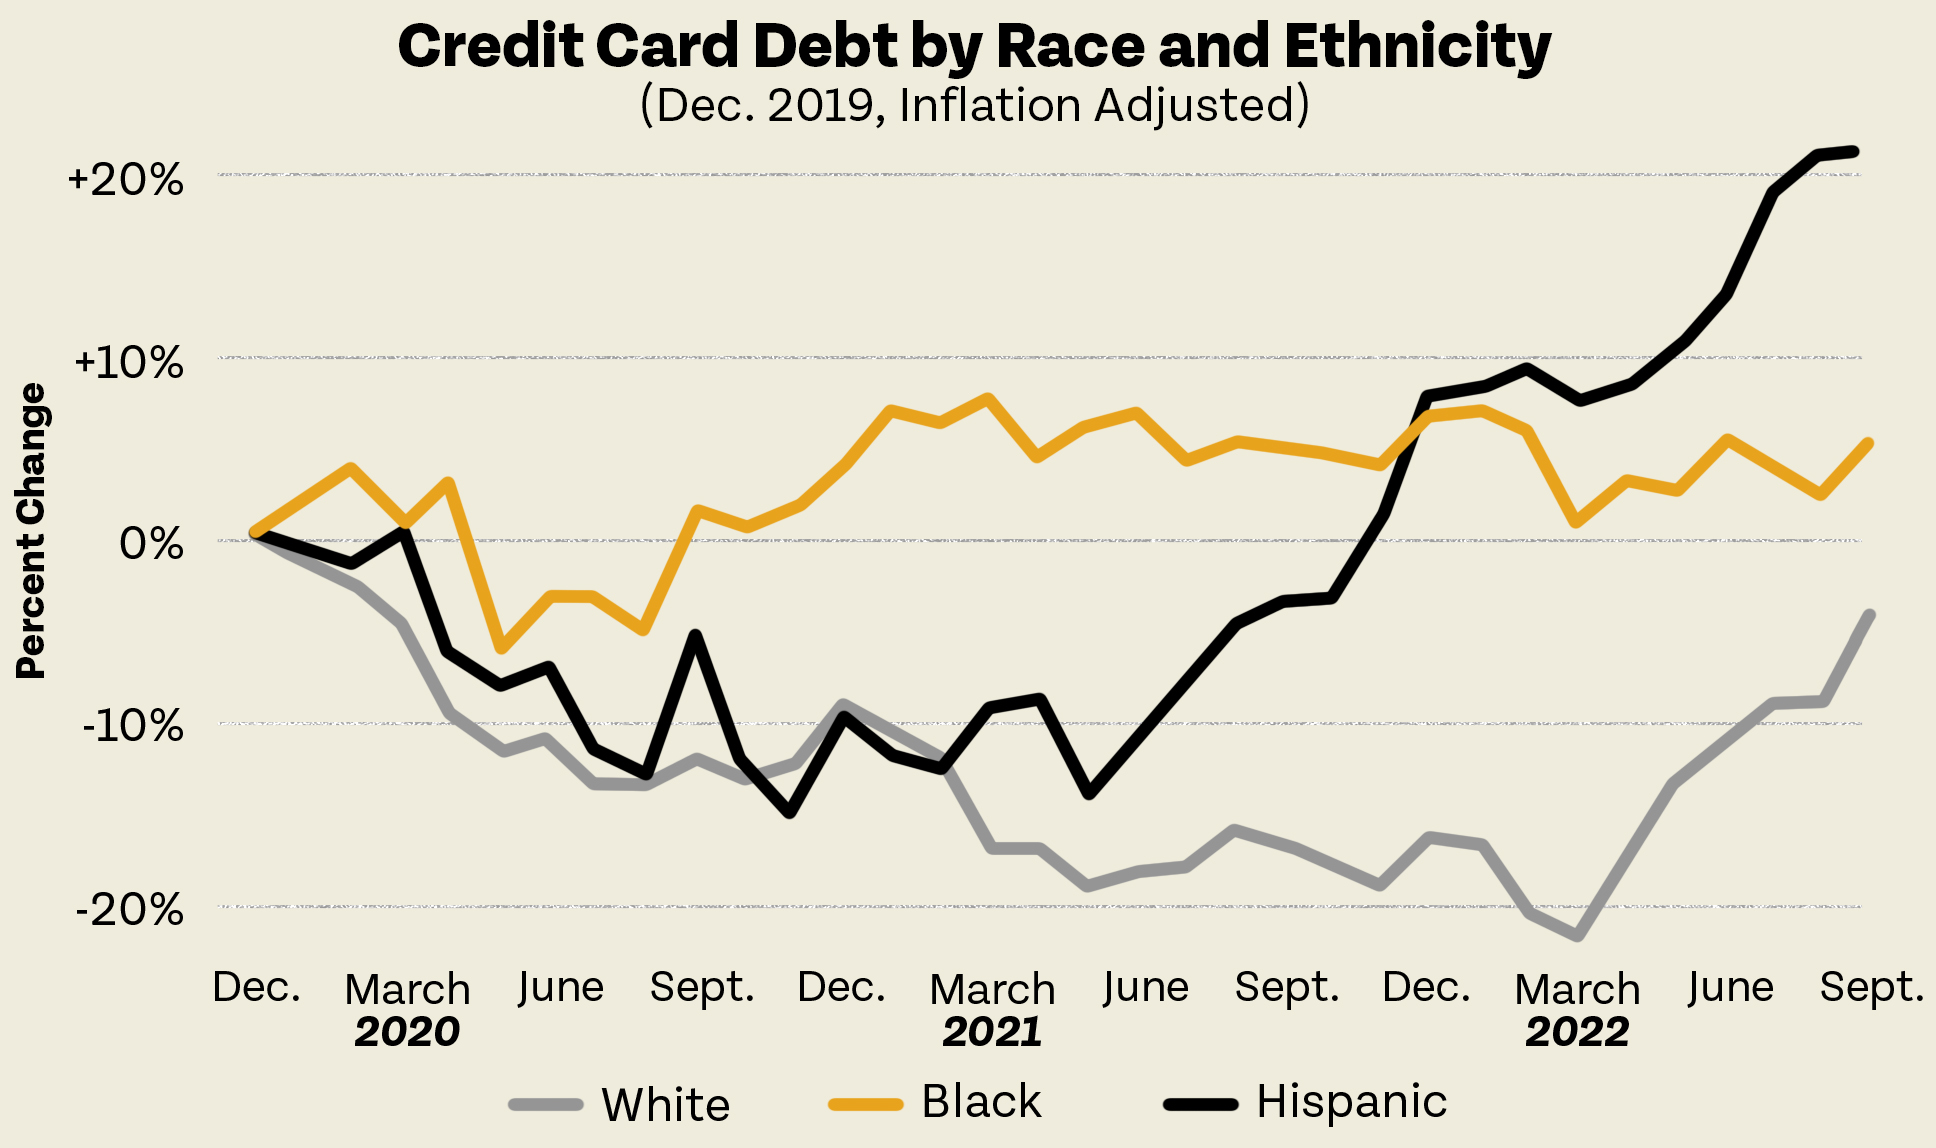
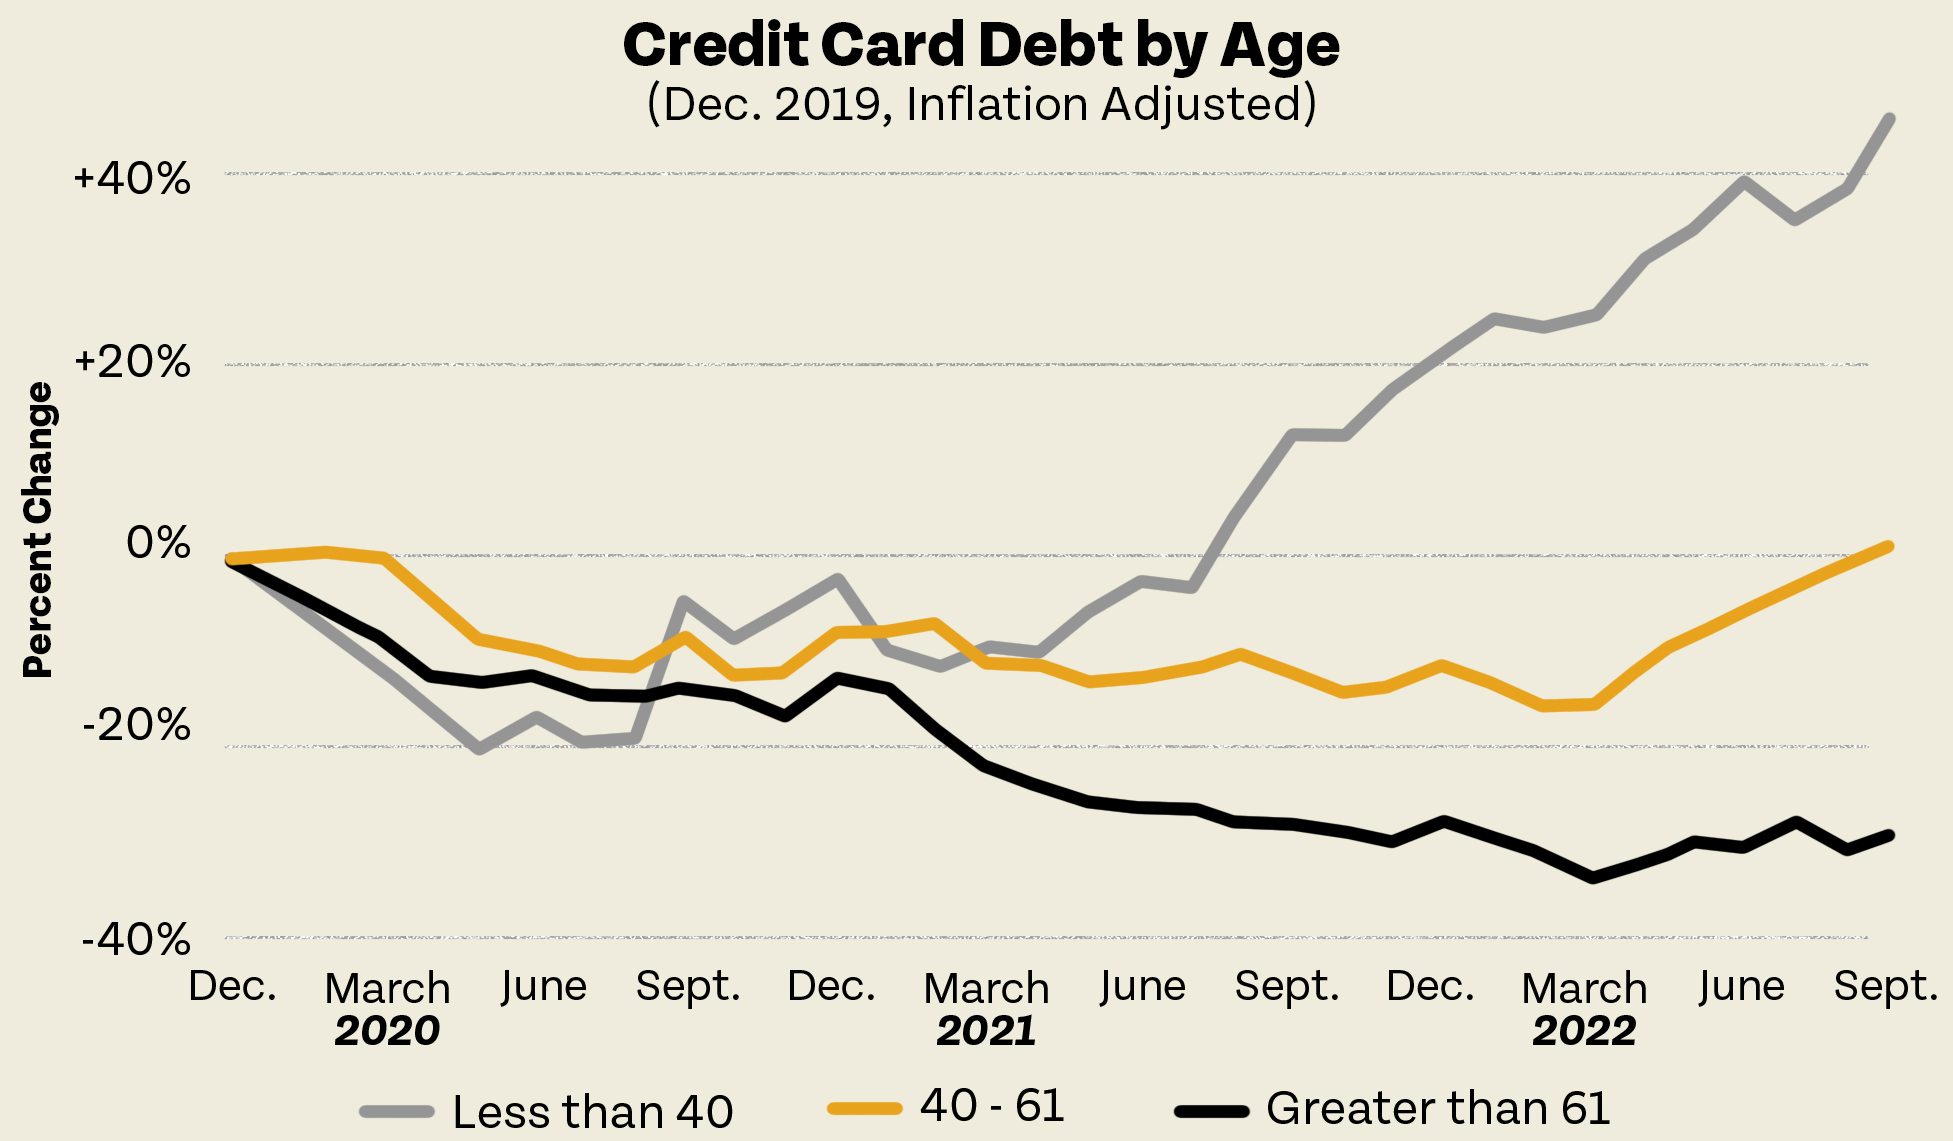
Though largely rosy, we should note that the information above likely obscures granular demographic differences that we can’t explore for lack of public data. For example, the charts below show changes in credit card debt across the country by race, ethnicity, and age. Notably, younger and Hispanic households grew their credit card debt by a greater percentage than peer households. They are among the groups that carried some of the most significant economic costs from the pandemic.
Recent Trends in AFS Debt
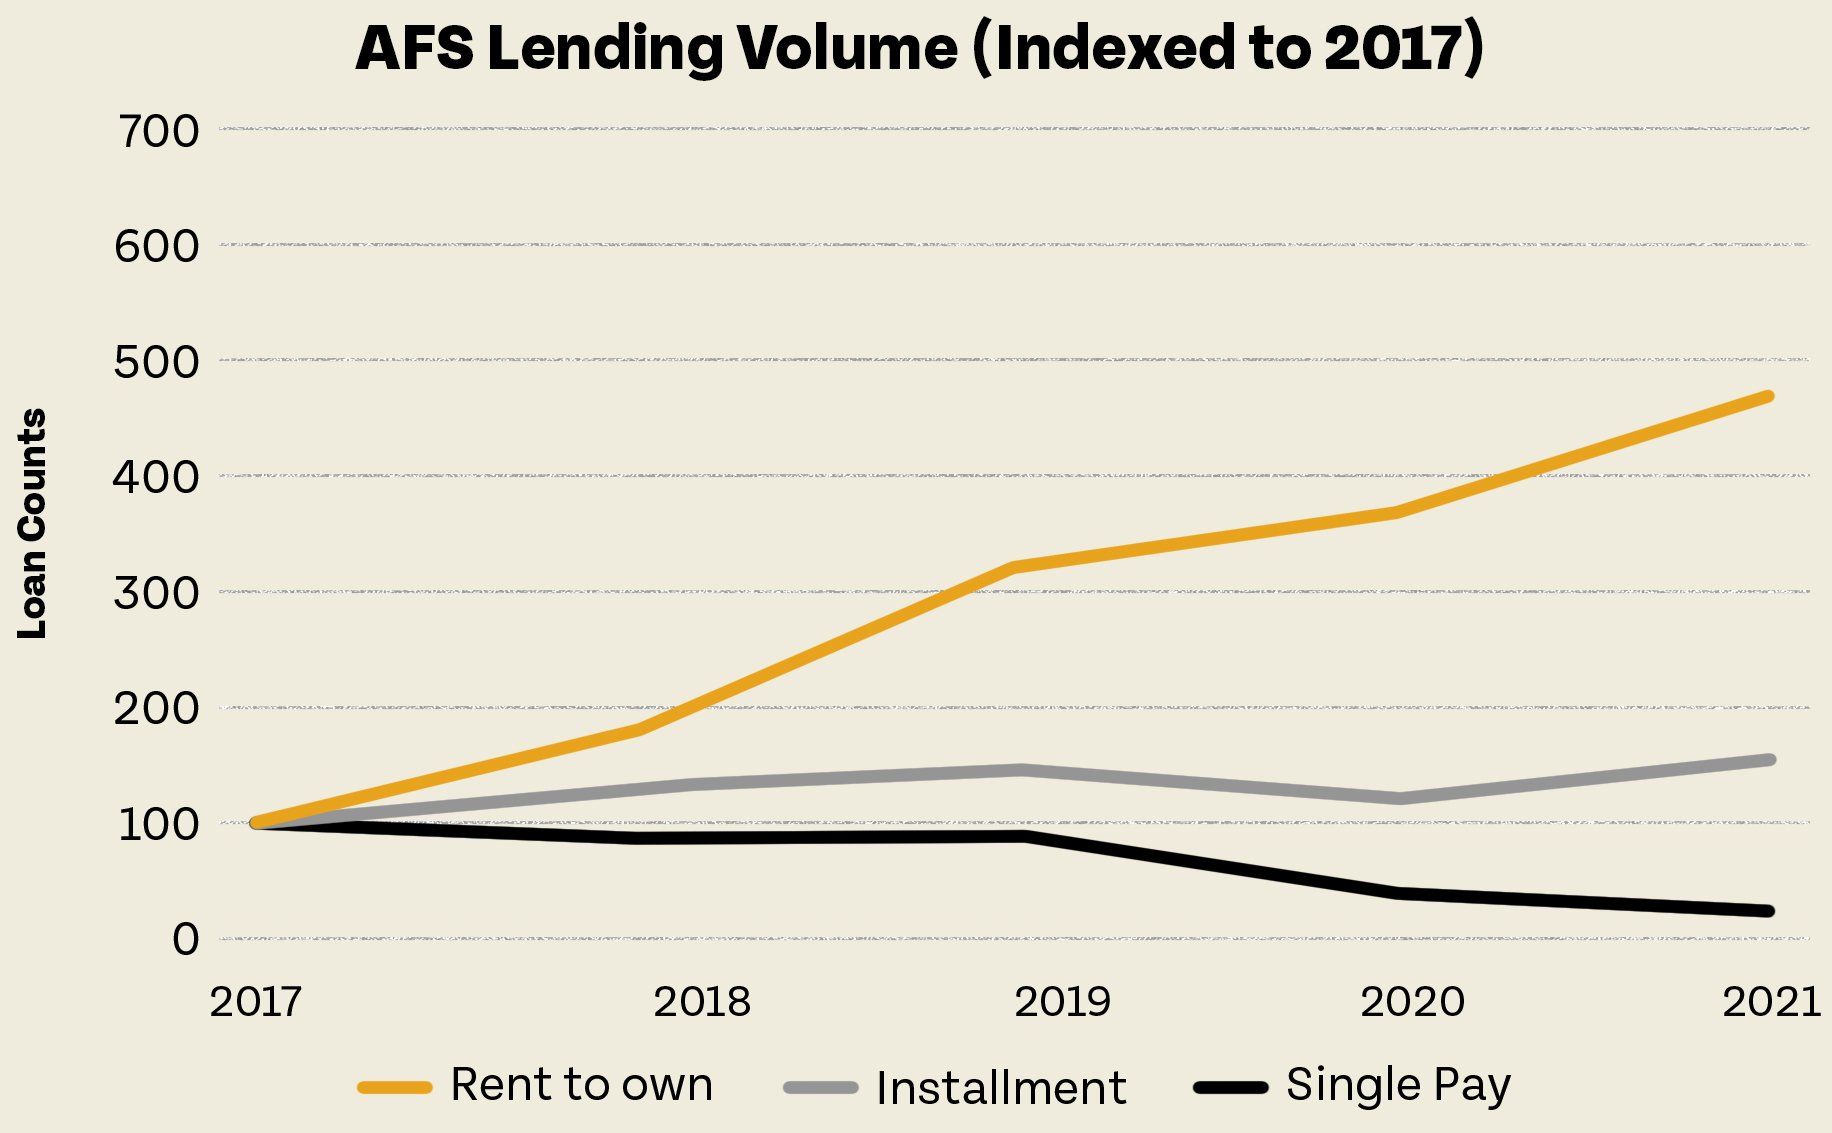
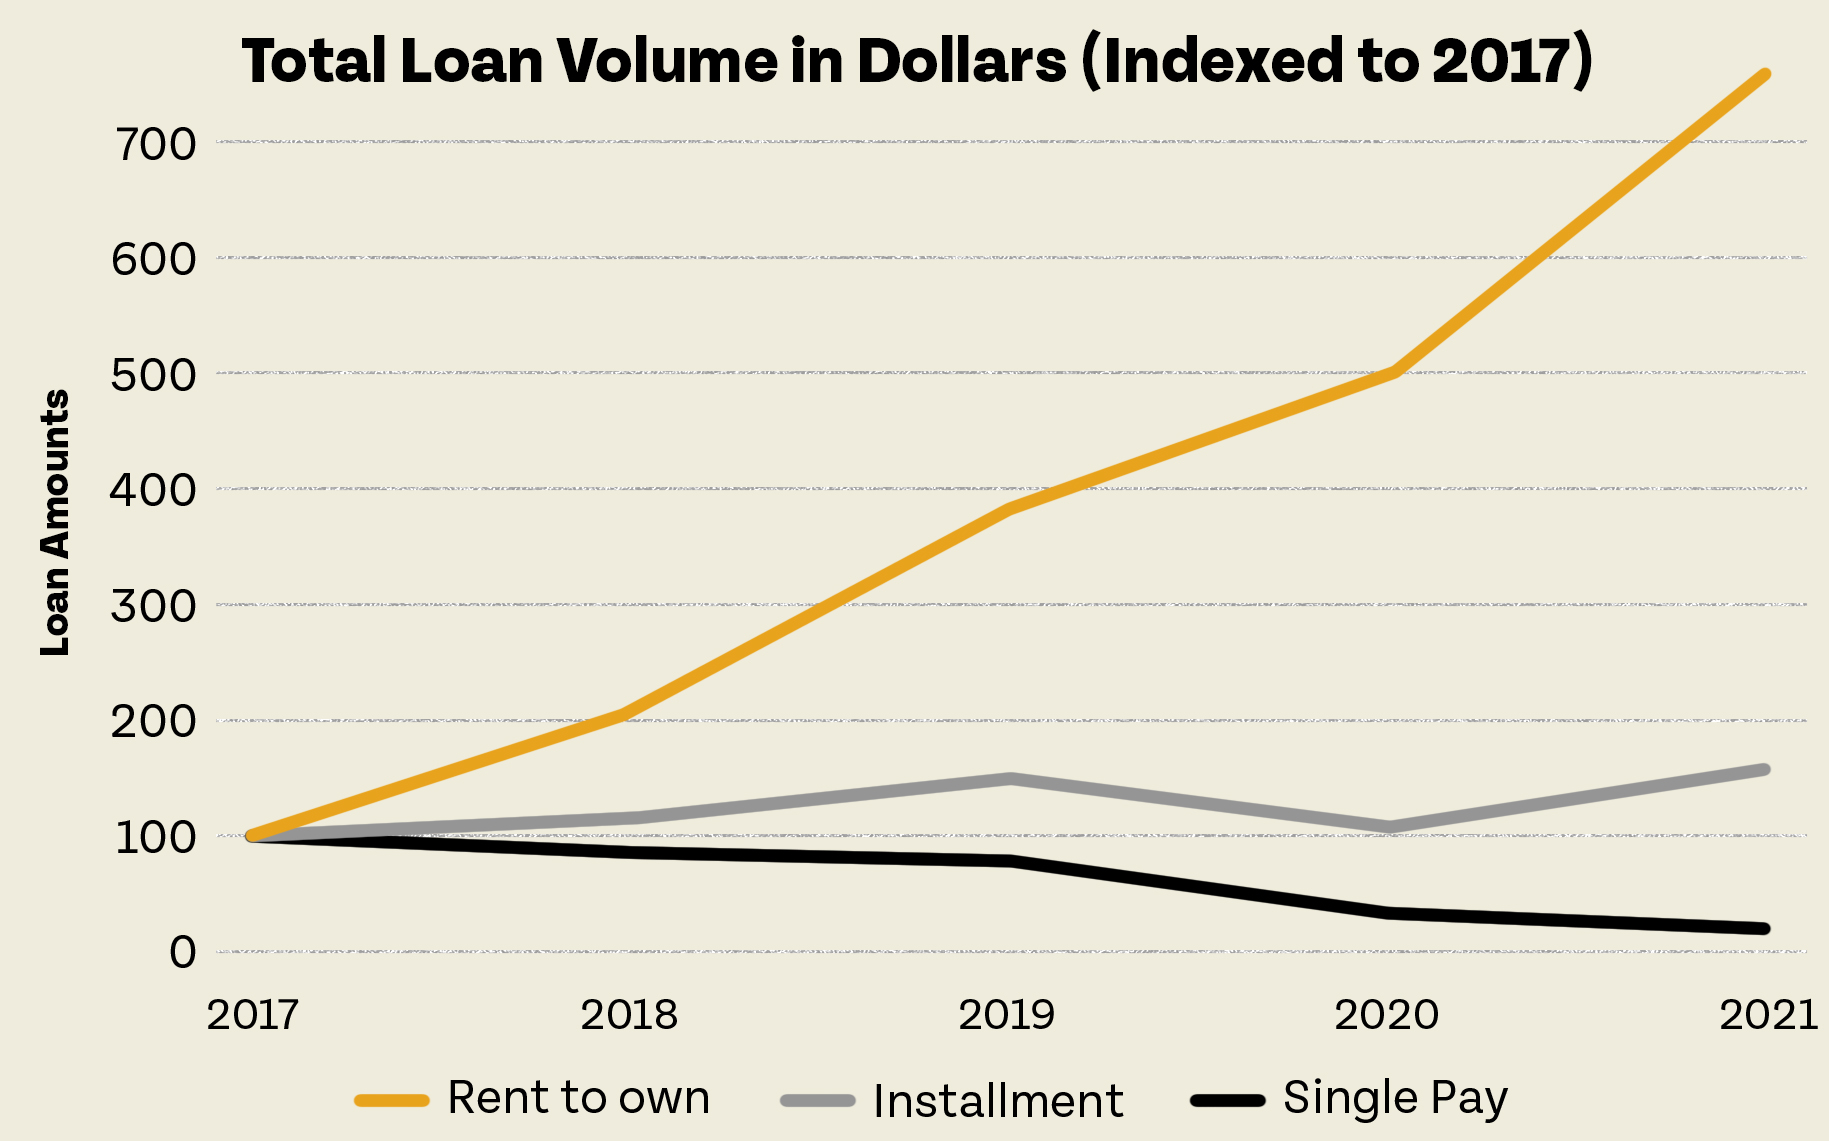
Compared to traditional loans, there is a dearth of information about AFS products — particularly at the state level. However, available national data shows an overall increase in AFS loans throughout the past several years. This is true both in the number of loans and the total amount of money loaned. However, trends differ by product. Rent-to-own loans have seen the largest increase in volume, followed by installment loans. By contrast, single pay loans (ex: payday loans) have steadily declined since at least 2017.
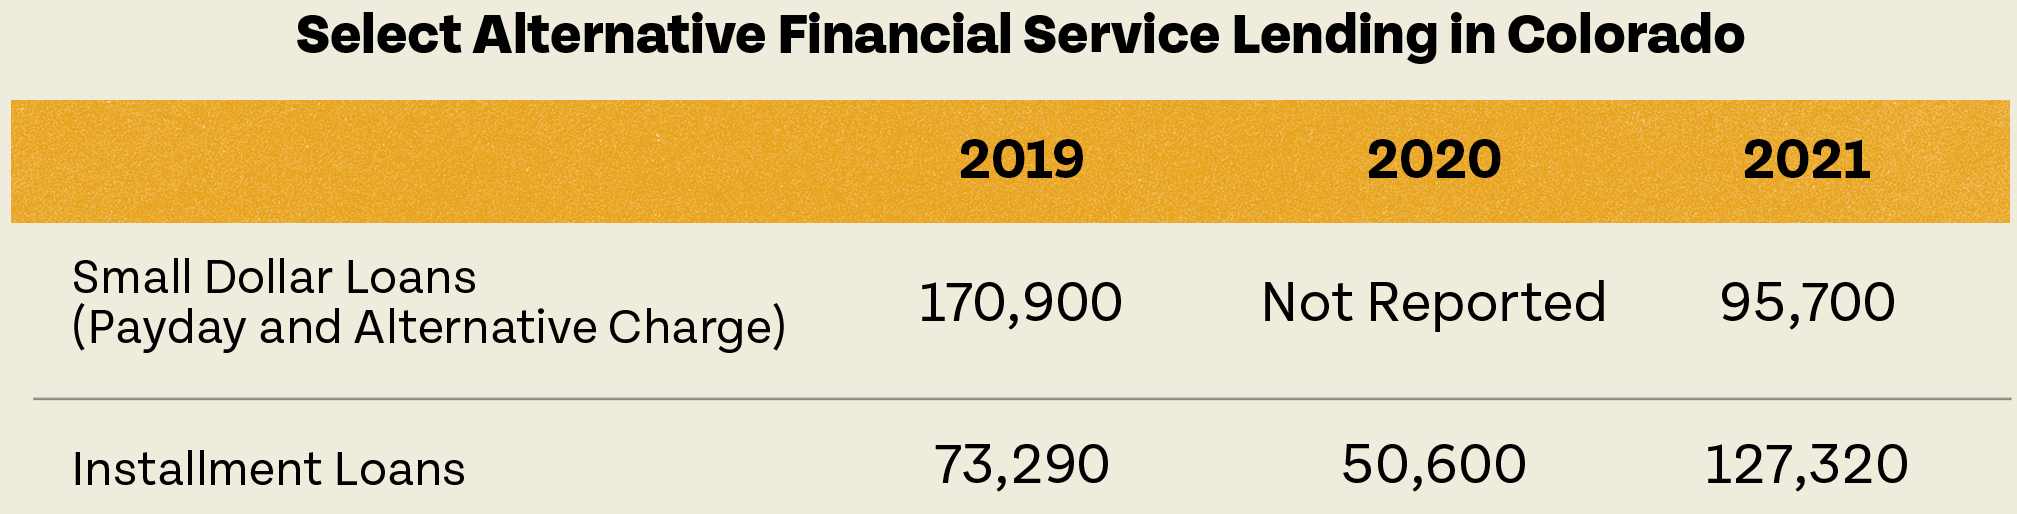
Colorado-specific information about AFS products is very limited. While the Attorney General does license and collect information from AFS lenders, the Attorney General makes that information public on an intermittent basis. However, 2021 legislation required Colorado’s Attorney General to issue a one-time report on two common AFS products. Those products were small dollar loans (inclusive of both payday and alternative charge loans) and installment loans. Colorado data from this report mirrors national lending trends.
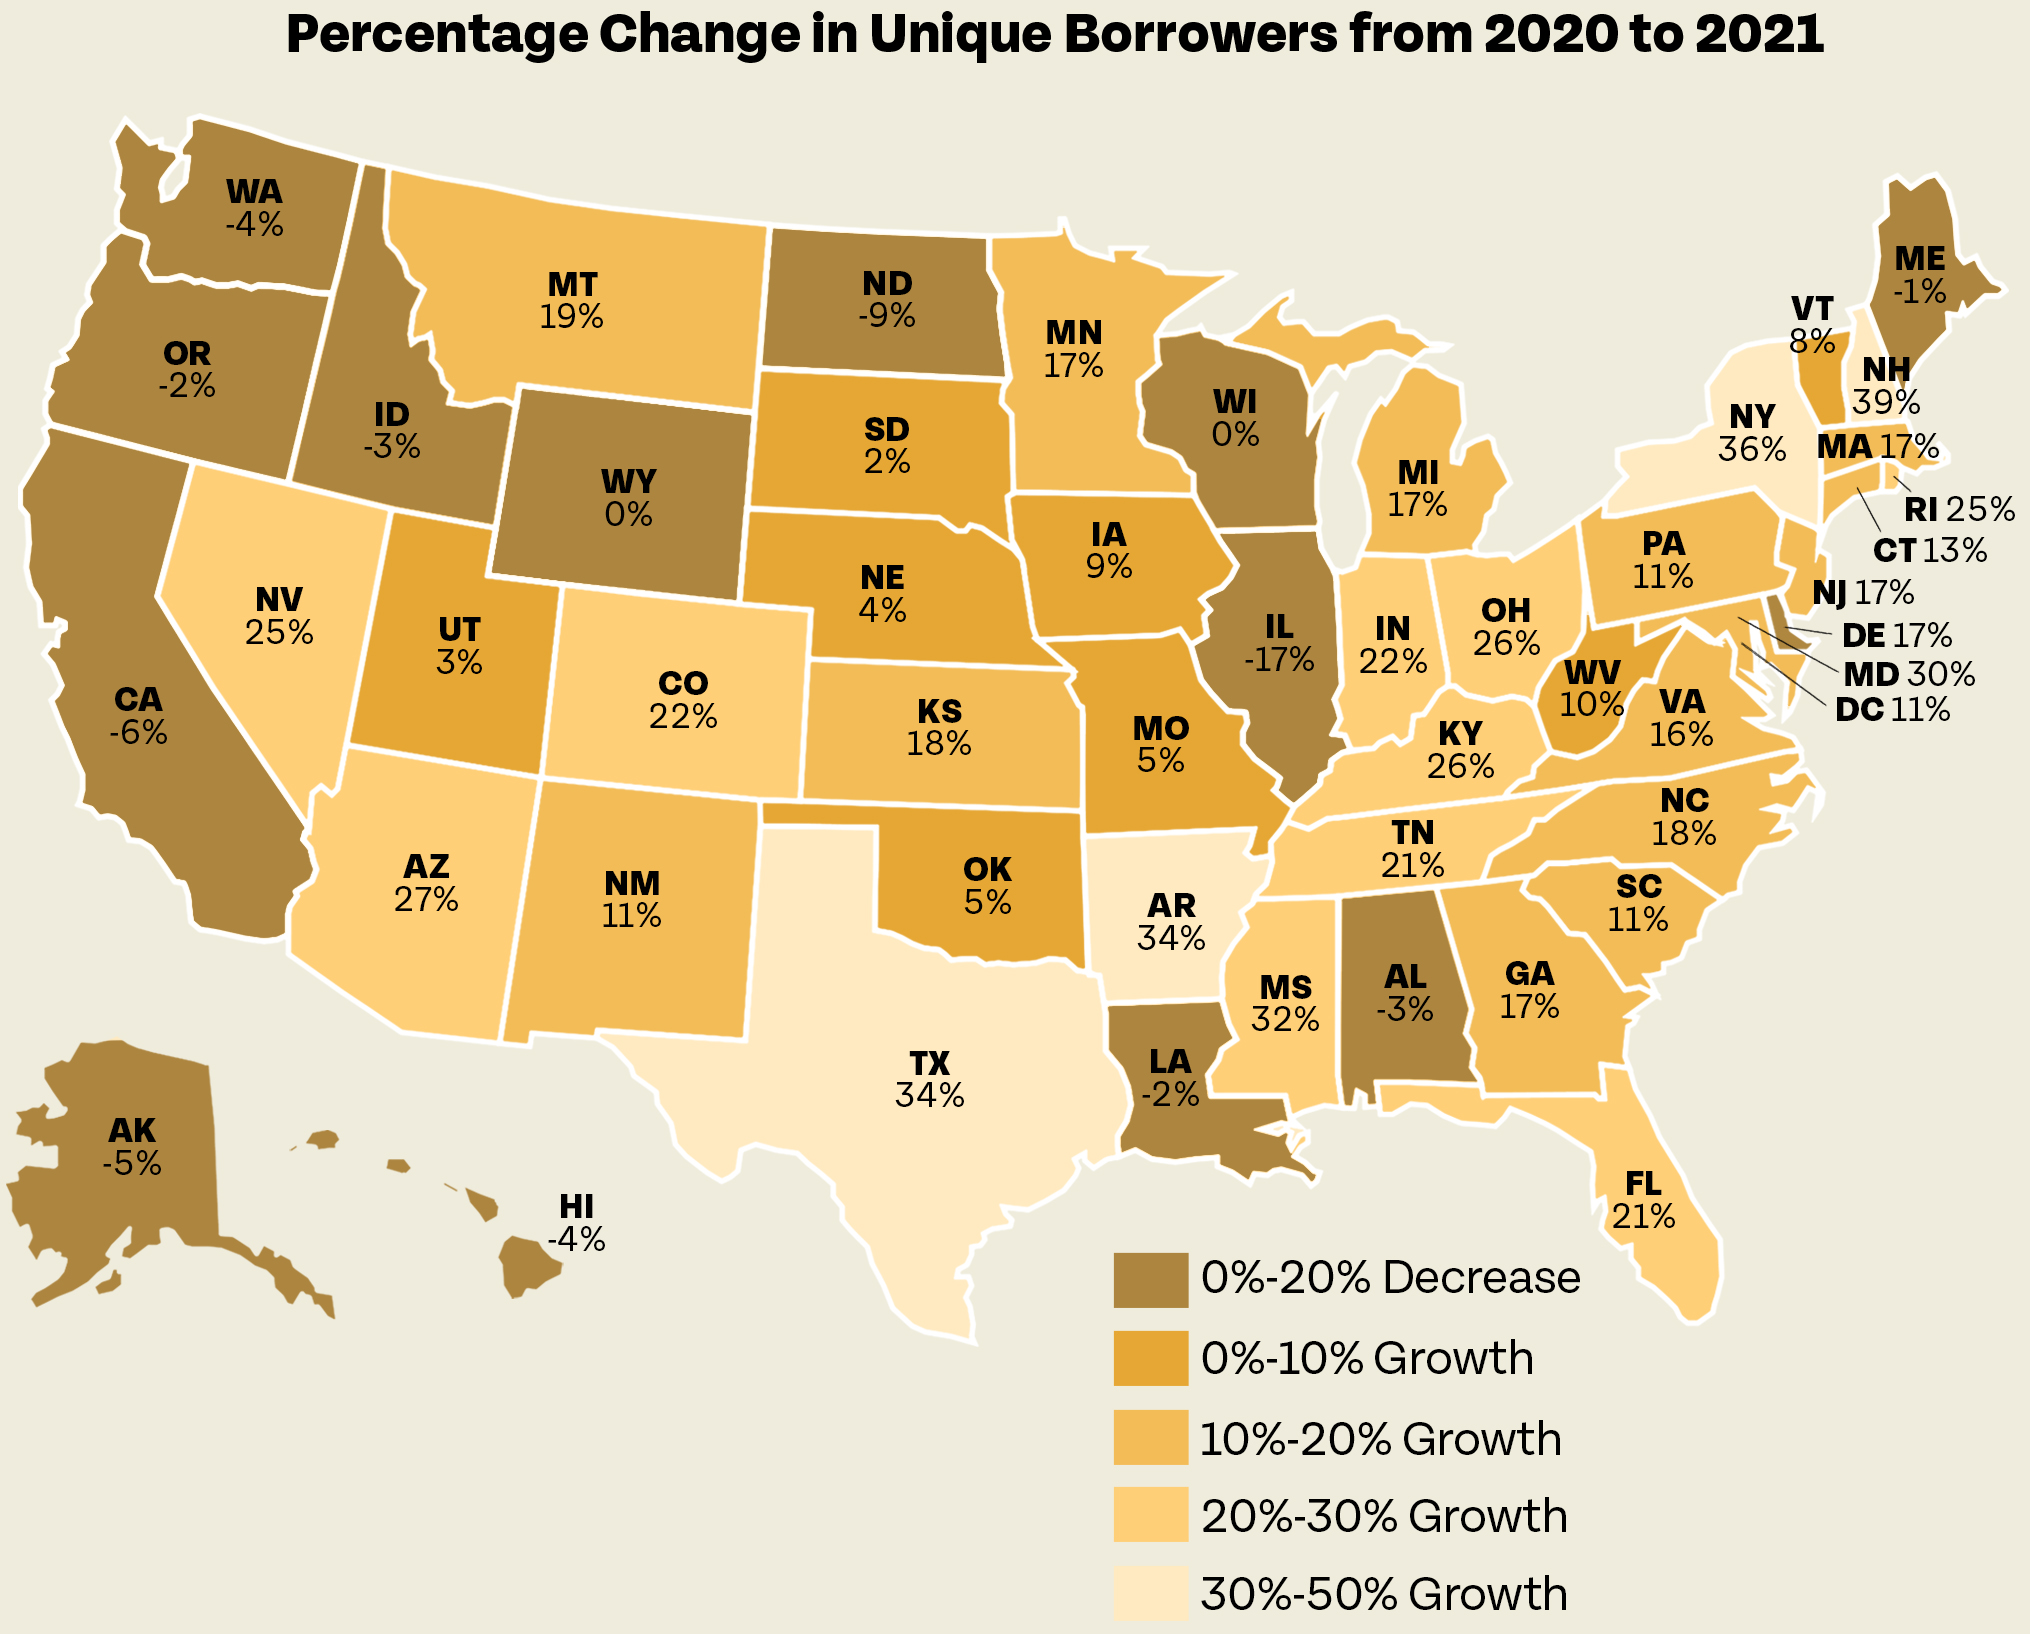
To provide additional context, the following map shows the percent change in the number of individuals using AFS products between 2020 and 2021. As seen below, the number of Coloradans taking out AFS loans grew by one of the fastest rates in the country.
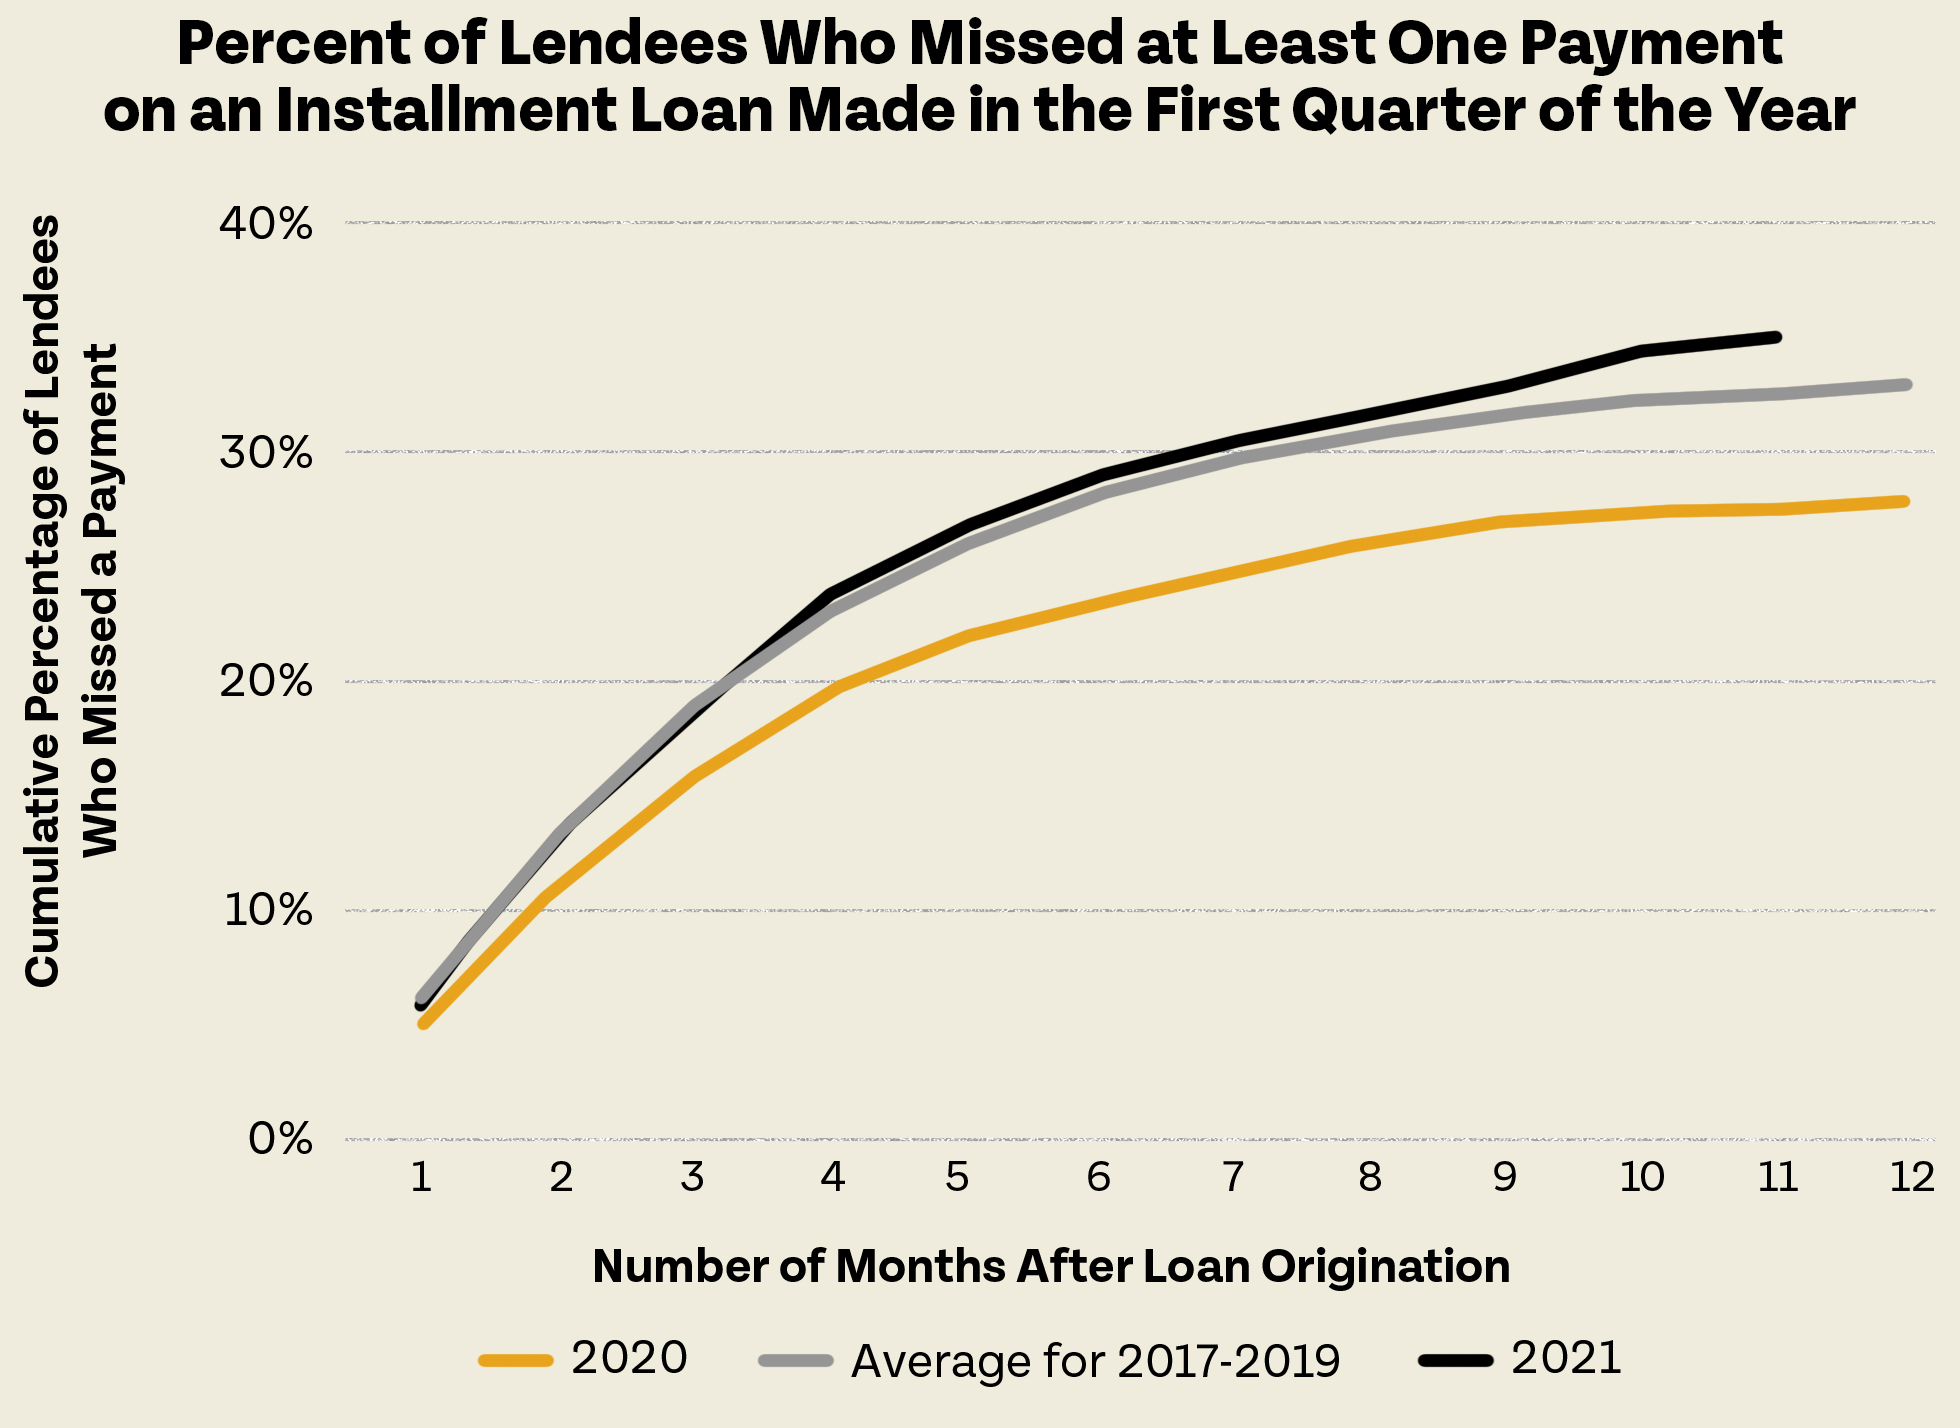
Concerningly, there are growing signs of financial stress amongst AFS users. The chart below shows the percentage of individuals who took out an installment loan in the first quarter of the year and then missed a payment. Notably, missed payment rates rose significantly between 2020 and 2021. They are now above pre-pandemic levels.
Unfortunately, there isn’t publicly available information about how Coloradans have fared with these products. However, there’s little reason to believe their experiences deviate much from others across the country.
Takeaways
Taken together, the above data begins to paint a picture of evolving debt trends in Colorado. Several of the largest, most important takeaways include:
- During the pandemic, debt decreased for most Coloradans — including those who use both AFS and traditional lending products. This drop in debt, which happened despite layoffs and significant economic uncertainty, can largely be attributed to temporary federal investments in the social safety net.
- As pandemic aid ends, the economic fortunes of Coloradans are beginning to diverge — and with it their experiences with debt. Though there are some signs that traditional debt is increasing, much of this can be attributed to more expensive mortgages. Notably, however, default rates for all major traditional loans remain below pre-pandemic levels.
- By contrast, the pandemic hit predominantly lower-income Coloradans the hardest. They disproportionately rely upon AFS loans and are not only taking on more debt, but are increasingly facing repayment challenges. Delinquency rates for installment loans — the most prevalent AFS product — have already surpassed pre-pandemic levels.
- Finally, it should be noted that there are significant data disparities between both AFS and traditional loans, which makes a comprehensive understanding of debt across demographic groups in Colorado difficult.
These takeaways are perhaps unsurprising, and reflect things we have long known: debt is experienced differently across communities; and for families with low incomes, debt is often an income problem.
During COVID, higher-income families grew their debt, but largely because they took on larger mortgages, an investment that is expected to bolster their financial future. In contrast, those with lower incomes used federal assistance to pay off previously accumulated debt. Yet, now that federal assistance is ending, both their overall debt and delinquencies are rising — likely impacted by the higher interest rates and charges that accompany AFS products.
This data makes clear that the bifurcation of Colorado experiences with debt is real, and that enhancing the social safety net can alleviate debt challenges for families with lower incomes.
Colorado Efforts
Though federal pandemic assistance has largely run its course, ongoing and potentially new state-based efforts can support Coloradans, particularly those who use AFS products.
Expanding Banking Access
During the 2021 legislative session, Colorado created the country’s first statewide Office of Financial Empowerment (OFE). This office supports community wealth-building strategies, the development of financial counseling and coaching services, and expanded access to safe and affordable banking and credit.
In its first year, the OFE prioritized supporting BankOn Colorado. This effort is meant to help connect unbanked and underbanked Coloradans to low-cost bank accounts. This work is vital to expanding access to the traditional, lower-cost lending options discussed above.
Offering Affordable, Small Dollar Loans
In addition to the OFE, Colorado is in the process of creating a new small dollar loan fund. When operational, this fund will provide low-cost loans to households hardest hit by the pandemic and have had historically limited access to traditional credit. This fund will provide credit access to these Coloradans without the unreasonably high rates and fees that accompany AFS products.
Maintaining Existing Consumer Protections
To minimize the harm of high interest rates and fees on AFS products, Colorado intentionally created robust consumer protection laws. These include a 36 percent APR for payday loans and tiered rate caps for installment loans. There are, however, regular efforts to roll back and get around these regulations. Especially if AFS debt levels continue to rise, maintaining and strengthening these protections will play an essential role in minimizing the detrimental impacts of high interest and fees that often come with AFS products.
Collecting and Publicizing AFS Data
Finally, as discussed above, there is a dearth of Colorado-specific AFS data. However, the state does collect some of this information. It simply isn’t made public. The state can, and should, take steps to make aggregated AFS data public, a move that will help shed light on the extent and connected impact of this debt.
In addition, however, to publicizing extant data, it will also be important for the state to be forward-thinking about the information it collects. As discussed earlier, rent-to-own loans are among the fastest growing AFS products in the country. Collecting information on these and other AFS products which may emerge in the future will be vital to proactively addressing future debt traps.
Conclusion
Debt is a reality for many Coloradans. However, its impact is not the same and often varies across communities. This has become very apparent in the aftermath of COVID, as lower-income AFS users are seeing both a rise in their debt and delinquency rates compared to others who use traditional lending products.
What this data shows is that one’s income, assets, and access to credit matter. These factors directly impact a family’s ability to weather an economic crisis, whether it is caused by a once-in-a-lifetime pandemic or the all-too-common setbacks that come with an unexpected job loss or sickness. To build the resilient state we all aspire to, growing family income, helping individuals build and retain assets, and providing access to meaningful, low-cost credit are the fundamental challenges that Colorado must address.